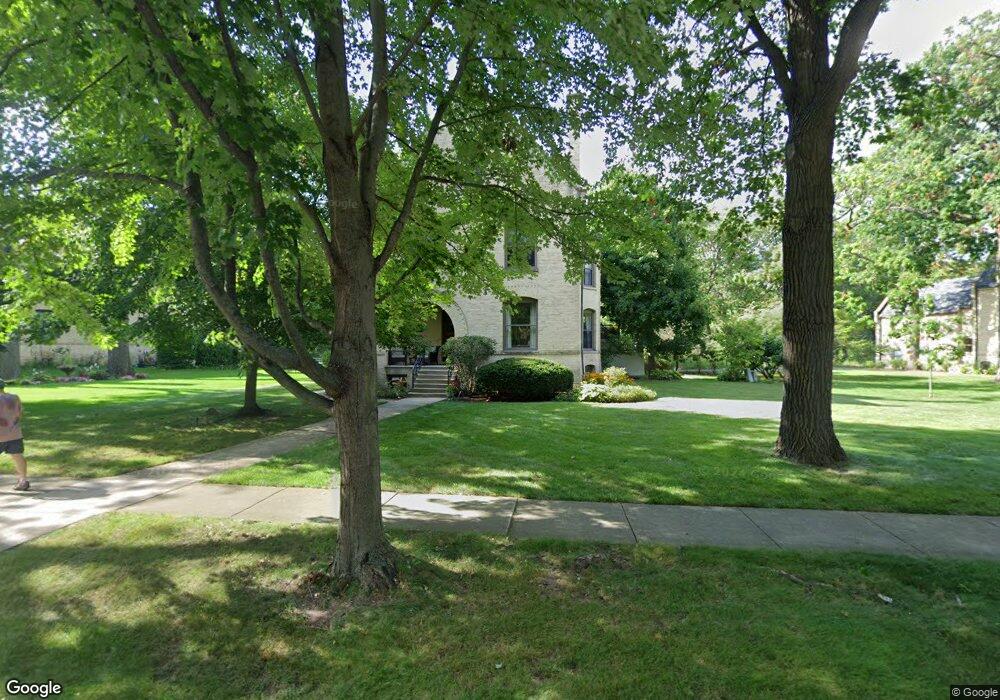
51 Macarthur Loop Highland Park, IL 60035
West Highland Park NeighborhoodEstimated Value: $1,184,016 - $1,556,000
Studio
4
Baths
3,752
Sq Ft
$359/Sq Ft
Est. Value
About This Home
This home is located at 51 Macarthur Loop, Highland Park, IL 60035 and is currently estimated at $1,348,254, approximately $359 per square foot. 51 Macarthur Loop is a home located in Lake County with nearby schools including Wayne Thomas Elementary School, Northwood Jr High School, and Highland Park High School.
Ownership History
Date
Name
Owned For
Owner Type
Purchase Details
Closed on
May 29, 2002
Sold by
Tippens William W and Obrien Christine A
Bought by
Tippens William W and The William W Tippens Trust
Current Estimated Value
Purchase Details
Closed on
Aug 24, 1998
Sold by
Tfs Operating Company Llc
Bought by
Tippens William W and Obrien Christine A
Home Financials for this Owner
Home Financials are based on the most recent Mortgage that was taken out on this home.
Original Mortgage
$239,400
Outstanding Balance
$48,125
Interest Rate
6.5%
Estimated Equity
$1,300,129
Create a Home Valuation Report for This Property
The Home Valuation Report is an in-depth analysis detailing your home's value as well as a comparison with similar homes in the area
Home Values in the Area
Average Home Value in this Area
Purchase History
| Date | Buyer | Sale Price | Title Company |
|---|---|---|---|
| Tippens William W | -- | -- | |
| Obrien Christine A | -- | -- | |
| Tippens William W | $342,000 | -- |
Source: Public Records
Mortgage History
| Date | Status | Borrower | Loan Amount |
|---|---|---|---|
| Open | Tippens William W | $239,400 |
Source: Public Records
Tax History
| Year | Tax Paid | Tax Assessment Tax Assessment Total Assessment is a certain percentage of the fair market value that is determined by local assessors to be the total taxable value of land and additions on the property. | Land | Improvement |
|---|---|---|---|---|
| 2024 | $26,271 | $341,115 | $63,236 | $277,879 |
| 2023 | $24,300 | $307,477 | $57,000 | $250,477 |
| 2022 | $24,300 | $275,839 | $62,617 | $213,222 |
| 2021 | $22,403 | $266,640 | $60,529 | $206,111 |
| 2020 | $21,677 | $266,640 | $60,529 | $206,111 |
| 2019 | $23,058 | $291,547 | $60,246 | $231,301 |
| 2018 | $13,003 | $305,094 | $70,403 | $234,691 |
| 2017 | $22,432 | $303,335 | $69,997 | $233,338 |
| 2016 | $21,631 | $288,780 | $66,638 | $222,142 |
| 2015 | $20,972 | $268,308 | $61,914 | $206,394 |
| 2014 | $20,499 | $256,337 | $69,127 | $187,210 |
| 2012 | $19,934 | $257,832 | $69,530 | $188,302 |
Source: Public Records
Map
Nearby Homes
- 34 Logan Loop Unit 242
- 3481 Bradley Ct
- 595 Circle Ln
- 0 Patten Rd
- 44 Westover Rd
- 3373 Brook Rd
- 512 Hill St
- 3272 Western Ave
- 308 Washington Ave
- 535 Lockard Ln
- 43 Clay Ave
- 525 Lockard Ln
- 786 Hill St
- 239 Sheridan Ave
- 890 Cherokee Rd
- 225 Burchell Ave
- 719 Burchell Ave
- 840 Auburn Ct
- 417 Temple Ave
- 528 Linden Ave
- 59 Macarthur Loop
- 37 Macarthur Loop
- 50 Macarthur Loop
- 58 Macarthur Loop
- 46 Macarthur Loop
- 69 Macarthur Loop
- 36 Macarthur Loop
- 68 Macarthur Loop
- 27 Macarthur Loop
- 61 Scott Loop
- 51 Scott Loop
- 77 Macarthur Loop
- 47 Scott Loop
- 26 Macarthur Loop
- 41 Scott Loop
- 85 Leonard Wood N
- 33 Scott Loop
- 6 Cliff Rd
- 6 Cliff Rd
- 46 Scott Loop
Your Personal Tour Guide
Ask me questions while you tour the home.