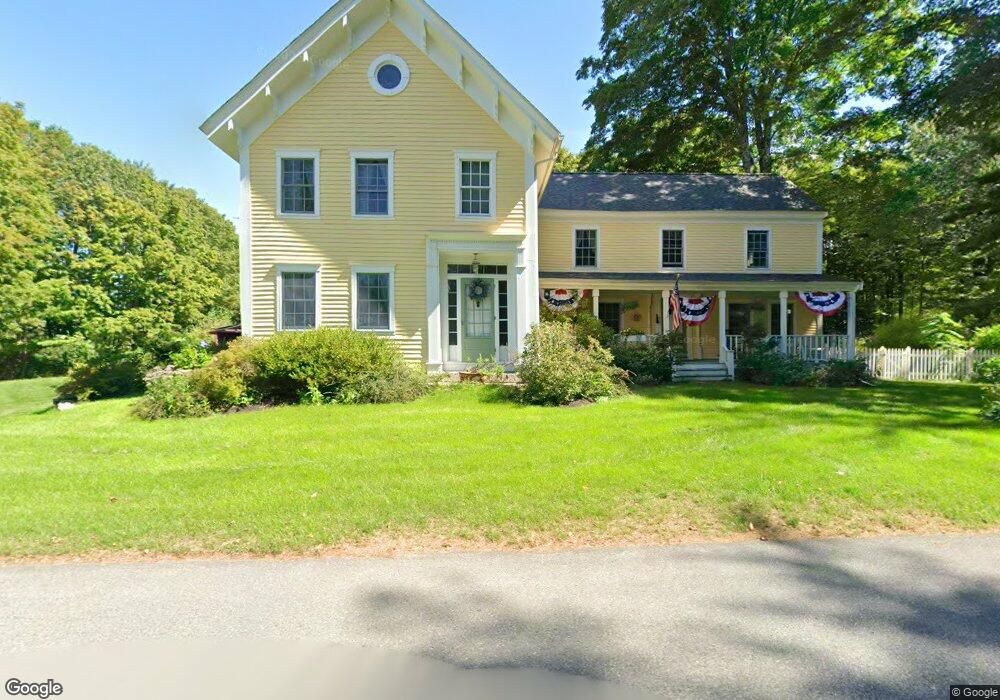
51 Maple St Unit 55 Pepperell, MA 01463
Estimated Value: $717,080 - $805,000
4
Beds
3
Baths
3,179
Sq Ft
$236/Sq Ft
Est. Value
About This Home
This home is located at 51 Maple St Unit 55, Pepperell, MA 01463 and is currently estimated at $749,270, approximately $235 per square foot. 51 Maple St Unit 55 is a home located in Middlesex County with nearby schools including North Middlesex Regional High School and Pepperell Christian Academy.
Ownership History
Date
Name
Owned For
Owner Type
Purchase Details
Closed on
Feb 9, 2023
Sold by
March Noeleen A and March Peter C
Bought by
Noeleen A March Ret
Current Estimated Value
Purchase Details
Closed on
Aug 23, 2002
Sold by
Nordlie Kristen R
Bought by
March Peter C and March Noeleen A
Home Financials for this Owner
Home Financials are based on the most recent Mortgage that was taken out on this home.
Original Mortgage
$225,000
Interest Rate
6.57%
Mortgage Type
Purchase Money Mortgage
Purchase Details
Closed on
Sep 11, 1989
Sold by
Daugherty Wayne
Bought by
X-L Co Inc
Create a Home Valuation Report for This Property
The Home Valuation Report is an in-depth analysis detailing your home's value as well as a comparison with similar homes in the area
Home Values in the Area
Average Home Value in this Area
Purchase History
| Date | Buyer | Sale Price | Title Company |
|---|---|---|---|
| Noeleen A March Ret | -- | None Available | |
| March Peter C | $425,000 | -- | |
| X-L Co Inc | $309,000 | -- |
Source: Public Records
Mortgage History
| Date | Status | Borrower | Loan Amount |
|---|---|---|---|
| Previous Owner | X-L Co Inc | $222,250 | |
| Previous Owner | March Peter C | $225,000 | |
| Previous Owner | X-L Co Inc | $186,800 |
Source: Public Records
Tax History
| Year | Tax Paid | Tax Assessment Tax Assessment Total Assessment is a certain percentage of the fair market value that is determined by local assessors to be the total taxable value of land and additions on the property. | Land | Improvement |
|---|---|---|---|---|
| 2025 | $9,754 | $666,700 | $180,300 | $486,400 |
| 2024 | $9,322 | $649,600 | $163,200 | $486,400 |
| 2023 | $9,055 | $598,100 | $139,200 | $458,900 |
| 2022 | $9,328 | $543,900 | $137,000 | $406,900 |
| 2021 | $8,913 | $497,400 | $121,000 | $376,400 |
| 2020 | $8,531 | $502,400 | $121,000 | $381,400 |
| 2019 | $7,754 | $467,400 | $121,000 | $346,400 |
| 2018 | $7,046 | $429,900 | $121,000 | $308,900 |
| 2017 | $6,265 | $394,300 | $121,000 | $273,300 |
| 2016 | $6,212 | $375,800 | $121,000 | $254,800 |
| 2015 | $5,994 | $375,800 | $121,000 | $254,800 |
| 2014 | $5,762 | $363,300 | $121,000 | $242,300 |
Source: Public Records
Map
Nearby Homes
- 18 Maple St Unit 14
- 143 Heald St
- 13 Birch Dr
- 2 Everett Dr
- 2 Blueberry Hill Rd
- 6 High Oaks Path
- 90 Townsend St
- 96 Townsend St
- 120 Townsend St Unit 1
- 120 Townsend St Unit 2
- 14 Brookline St
- 43 Shattuck St
- 39 Hollis St Unit A
- 39 Mount Lebanon St
- 198 N End Rd
- 113-115 Main St
- 38 River Rd Unit 11
- 28-30 Groton St
- 8 Casie Ln
- 6 Skyline Dr
- 45 Maple St Unit 49
- 59 Maple St
- 86 Oak Hill St
- 84 Oak Hill St
- 80 Oak Hill St
- 57 Maple St Unit 59
- 189 Maple St
- 82 Oak Hill St
- 44 Maple St Unit 56
- 67 Oak Hill St
- 69 Oak Hill St
- 43 Maple St
- 63 Oak Hill St Unit 65
- 74 Oak Hill St Unit 78
- 61 Oak Hill St
- 3 Lawrence St
- 2 Lawrence St
- 41 Maple St
- 57 Oak Hill St
- 59 Oak Hill St
Your Personal Tour Guide
Ask me questions while you tour the home.