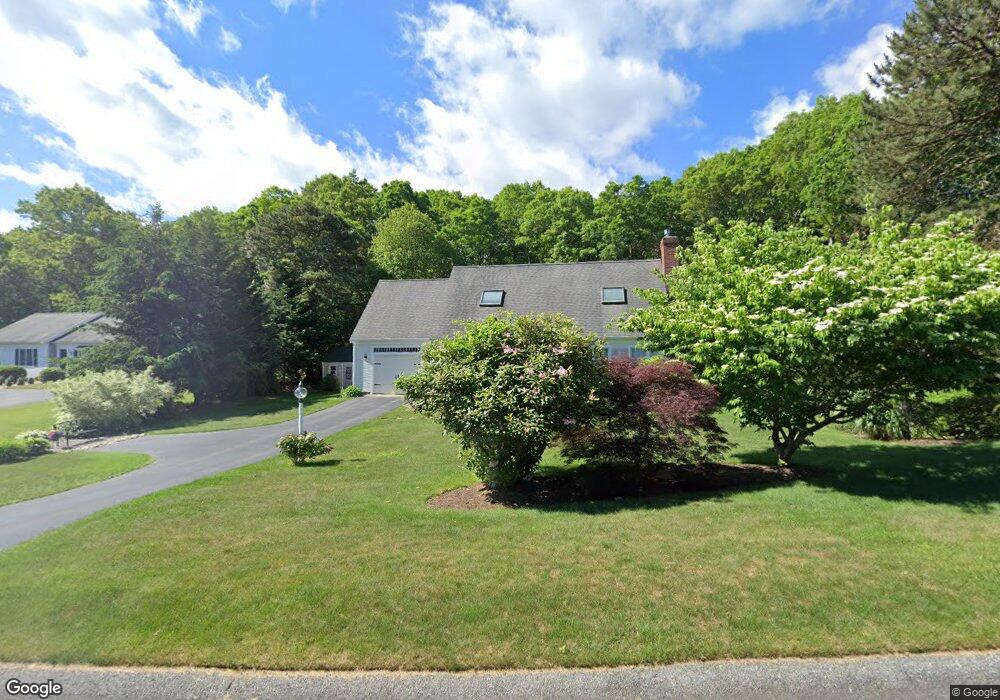
51 Morgan Way West Barnstable, MA 02668
West Barnstable NeighborhoodEstimated Value: $658,000 - $890,000
3
Beds
3
Baths
1,501
Sq Ft
$507/Sq Ft
Est. Value
About This Home
This home is located at 51 Morgan Way, West Barnstable, MA 02668 and is currently estimated at $760,497, approximately $506 per square foot. 51 Morgan Way is a home located in Barnstable County with nearby schools including Barnstable United Elementary School, West Barnstable Elementary School, and Barnstable Intermediate School.
Ownership History
Date
Name
Owned For
Owner Type
Purchase Details
Closed on
Jun 15, 2004
Sold by
Metrick Dennis and Metrick Kathleen B
Bought by
Graham Joyce and Graham Robert
Current Estimated Value
Purchase Details
Closed on
Jul 23, 1998
Sold by
Hunter Hill 3 Dev T and Dacey Brian T
Bought by
Metrick Kathleen B and Metrick Dennis
Home Financials for this Owner
Home Financials are based on the most recent Mortgage that was taken out on this home.
Original Mortgage
$165,000
Interest Rate
6.99%
Mortgage Type
Purchase Money Mortgage
Create a Home Valuation Report for This Property
The Home Valuation Report is an in-depth analysis detailing your home's value as well as a comparison with similar homes in the area
Home Values in the Area
Average Home Value in this Area
Purchase History
| Date | Buyer | Sale Price | Title Company |
|---|---|---|---|
| Graham Joyce | $415,000 | -- | |
| Metrick Kathleen B | $222,000 | -- |
Source: Public Records
Mortgage History
| Date | Status | Borrower | Loan Amount |
|---|---|---|---|
| Open | Metrick Kathleen B | $88,380 | |
| Previous Owner | Metrick Kathleen B | $161,500 | |
| Previous Owner | Metrick Kathleen B | $165,000 |
Source: Public Records
Tax History Compared to Growth
Tax History
| Year | Tax Paid | Tax Assessment Tax Assessment Total Assessment is a certain percentage of the fair market value that is determined by local assessors to be the total taxable value of land and additions on the property. | Land | Improvement |
|---|---|---|---|---|
| 2025 | $5,900 | $631,700 | $178,100 | $453,600 |
| 2024 | $5,209 | $607,100 | $178,100 | $429,000 |
| 2023 | $5,069 | $556,400 | $176,000 | $380,400 |
| 2022 | $4,978 | $448,100 | $125,100 | $323,000 |
| 2021 | $4,731 | $403,700 | $125,100 | $278,600 |
| 2020 | $4,841 | $399,400 | $125,100 | $274,300 |
| 2019 | $4,526 | $368,600 | $125,100 | $243,500 |
| 2018 | $4,328 | $349,300 | $137,200 | $212,100 |
| 2017 | $4,151 | $339,100 | $137,200 | $201,900 |
| 2016 | $4,080 | $340,300 | $138,400 | $201,900 |
| 2015 | $3,912 | $327,100 | $135,000 | $192,100 |
Source: Public Records
Map
Nearby Homes