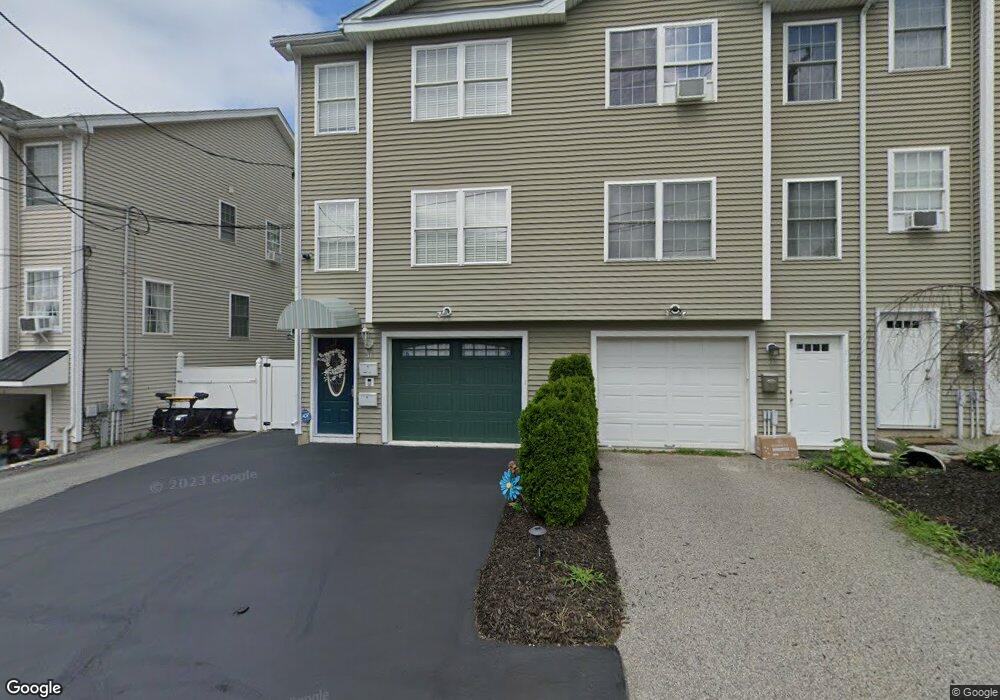
51 Randall St Unit 1 Worcester, MA 01606
Greendale NeighborhoodEstimated Value: $453,000 - $530,000
1
Bed
1
Bath
1,978
Sq Ft
$252/Sq Ft
Est. Value
About This Home
This home is located at 51 Randall St Unit 1, Worcester, MA 01606 and is currently estimated at $498,805, approximately $252 per square foot. 51 Randall St Unit 1 is a home located in Worcester County with nearby schools including Belmont Street Community School, Jacob Hiatt Magnet School, and Chandler Magnet.
Ownership History
Date
Name
Owned For
Owner Type
Purchase Details
Closed on
Sep 10, 2007
Sold by
Alcy Home Builders Inc
Bought by
Esposito Rose M
Current Estimated Value
Home Financials for this Owner
Home Financials are based on the most recent Mortgage that was taken out on this home.
Original Mortgage
$219,500
Outstanding Balance
$140,179
Interest Rate
6.74%
Mortgage Type
Purchase Money Mortgage
Estimated Equity
$358,626
Purchase Details
Closed on
Sep 29, 2006
Sold by
Right Time Home Bldrs
Bought by
Goncalves Elisabeth
Home Financials for this Owner
Home Financials are based on the most recent Mortgage that was taken out on this home.
Original Mortgage
$165,000
Interest Rate
6.52%
Mortgage Type
Purchase Money Mortgage
Purchase Details
Closed on
Jun 12, 2006
Sold by
Santos Alecxandro
Bought by
Alcy Home Builders Inc
Purchase Details
Closed on
Jun 29, 2005
Sold by
Marion D Elaine and Marion George R
Bought by
Santos Alecxandro
Home Financials for this Owner
Home Financials are based on the most recent Mortgage that was taken out on this home.
Original Mortgage
$220,000
Interest Rate
5.73%
Mortgage Type
Purchase Money Mortgage
Create a Home Valuation Report for This Property
The Home Valuation Report is an in-depth analysis detailing your home's value as well as a comparison with similar homes in the area
Home Values in the Area
Average Home Value in this Area
Purchase History
| Date | Buyer | Sale Price | Title Company |
|---|---|---|---|
| Esposito Rose M | $221,000 | -- | |
| Goncalves Elisabeth | $225,000 | -- | |
| Alcy Home Builders Inc | $200,000 | -- | |
| Right Time Home Bldrs | $150,000 | -- | |
| Santos Alecxandro | $350,000 | -- |
Source: Public Records
Mortgage History
| Date | Status | Borrower | Loan Amount |
|---|---|---|---|
| Open | Esposito Rose M | $219,500 | |
| Previous Owner | Goncalves Elisabeth | $165,000 | |
| Previous Owner | Santos Alecxandro | $220,000 |
Source: Public Records
Tax History
| Year | Tax Paid | Tax Assessment Tax Assessment Total Assessment is a certain percentage of the fair market value that is determined by local assessors to be the total taxable value of land and additions on the property. | Land | Improvement |
|---|---|---|---|---|
| 2025 | $5,583 | $423,300 | $79,200 | $344,100 |
| 2024 | $5,312 | $386,300 | $79,200 | $307,100 |
| 2023 | $5,118 | $356,900 | $68,900 | $288,000 |
| 2022 | $4,689 | $308,300 | $55,100 | $253,200 |
| 2021 | $4,588 | $281,800 | $44,100 | $237,700 |
| 2020 | $4,503 | $264,900 | $44,100 | $220,800 |
| 2019 | $4,522 | $251,200 | $39,700 | $211,500 |
| 2018 | $4,300 | $227,400 | $39,700 | $187,700 |
| 2017 | $4,050 | $210,700 | $39,700 | $171,000 |
| 2016 | $4,073 | $197,600 | $30,300 | $167,300 |
| 2015 | $3,966 | $197,600 | $30,300 | $167,300 |
| 2014 | $3,861 | $197,600 | $30,300 | $167,300 |
Source: Public Records
Map
Nearby Homes
- 30 Danielles Way
- 331 Burncoat St
- 323 Burncoat St
- 66 Eunice Ave
- 169 Whitmarsh Ave
- 39 Whitmarsh Ave
- 15 Ericsson St
- 53 Collins St
- 58 Osceola Ave
- 13 Fatima Ln
- 41 Mohave Rd
- 37 Mohave Rd
- 3205 Halcyon Dr Unit 3205
- 39 Mountainshire Dr
- 44 Boardman St
- 82 Holden St
- 31 Boardman St
- 120 Brattle St
- 270 Brattle St
- 12 Erie Ave
- 51 Randall St
- 55 Randall St
- 57 Randall St
- 53 Randall St
- 49 Randall St
- 47 Randall St
- 45 Randall St
- 43 Randall St
- 6 Hyde St
- 10 Emerson Rd
- 8 Hyde St
- 39 Randall St
- 62 Randall St
- 8 Emerson Rd
- 40 Randall St
- Lot 2,1295 Millbury St
- LOT 25 Frongillo Farm Rd
- LOT 3 Minna Dr
- LOT A Bridle Path
- #13 Snowbell Ln Unit 13,3
Your Personal Tour Guide
Ask me questions while you tour the home.