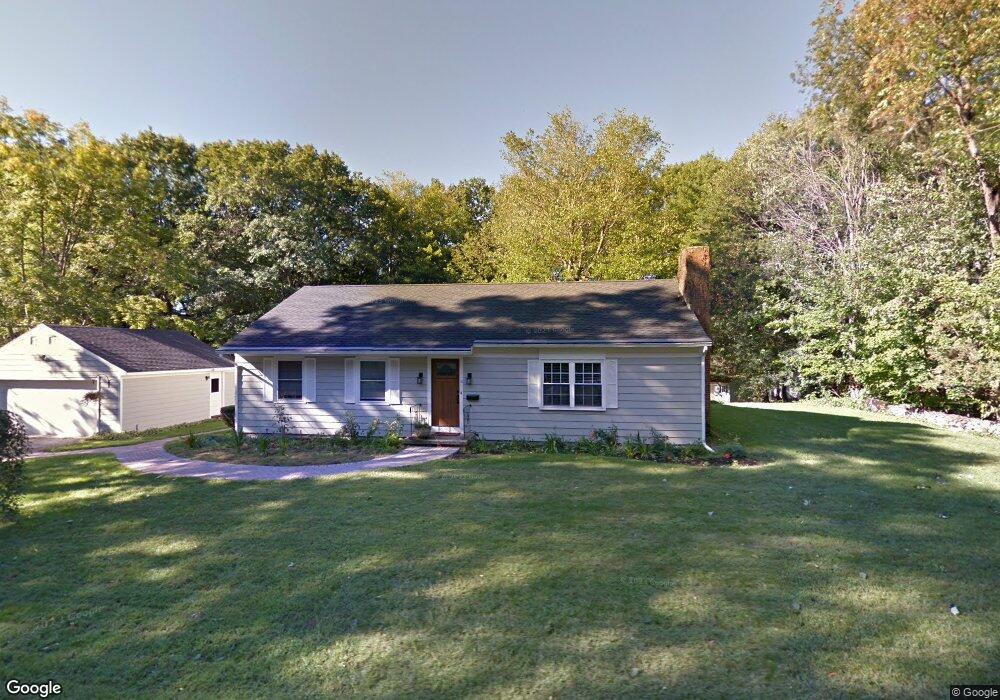
51 Ridge Rd Concord, NH 03301
North End NeighborhoodEstimated Value: $529,191 - $872,000
3
Beds
2
Baths
1,532
Sq Ft
$437/Sq Ft
Est. Value
About This Home
This home is located at 51 Ridge Rd, Concord, NH 03301 and is currently estimated at $669,048, approximately $436 per square foot. 51 Ridge Rd is a home located in Merrimack County with nearby schools including Christa McAuliffe School, Rundlett Middle School, and Concord High School.
Ownership History
Date
Name
Owned For
Owner Type
Purchase Details
Closed on
Jan 23, 2023
Sold by
F J Burdette Ret 2010
Bought by
Burdette Ft
Current Estimated Value
Purchase Details
Closed on
Mar 4, 2013
Sold by
Gunn William B
Bought by
Gunn W Bessent Jr Ft and Gunn
Purchase Details
Closed on
Apr 24, 2012
Sold by
Corum James L and Cassotis Alysia M
Bought by
Gunn William B
Home Financials for this Owner
Home Financials are based on the most recent Mortgage that was taken out on this home.
Original Mortgage
$243,371
Interest Rate
3.88%
Mortgage Type
Unknown
Purchase Details
Closed on
May 17, 2007
Sold by
William C Ingham T
Bought by
Corum James L
Home Financials for this Owner
Home Financials are based on the most recent Mortgage that was taken out on this home.
Original Mortgage
$255,920
Interest Rate
6.18%
Mortgage Type
Purchase Money Mortgage
Create a Home Valuation Report for This Property
The Home Valuation Report is an in-depth analysis detailing your home's value as well as a comparison with similar homes in the area
Home Values in the Area
Average Home Value in this Area
Purchase History
| Date | Buyer | Sale Price | Title Company |
|---|---|---|---|
| Burdette Ft | -- | None Available | |
| Burdette Ft | -- | None Available | |
| Gunn W Bessent Jr Ft | -- | -- | |
| Gunn W Bessent Jr Ft | -- | -- | |
| Gunn William B | $279,000 | -- | |
| Gunn William B | $279,000 | -- | |
| Corum James L | $322,700 | -- | |
| Corum James L | $322,700 | -- |
Source: Public Records
Mortgage History
| Date | Status | Borrower | Loan Amount |
|---|---|---|---|
| Previous Owner | Corum James L | $243,371 | |
| Previous Owner | Corum James L | $255,920 | |
| Closed | Corum James L | $0 |
Source: Public Records
Tax History
| Year | Tax Paid | Tax Assessment Tax Assessment Total Assessment is a certain percentage of the fair market value that is determined by local assessors to be the total taxable value of land and additions on the property. | Land | Improvement |
|---|---|---|---|---|
| 2025 | $12,124 | $416,500 | $189,400 | $227,100 |
| 2024 | $11,483 | $414,700 | $189,400 | $225,300 |
| 2023 | $10,868 | $404,600 | $189,400 | $215,200 |
| 2022 | $10,475 | $404,600 | $189,400 | $215,200 |
| 2021 | $10,116 | $402,700 | $189,400 | $213,300 |
| 2020 | $9,521 | $355,800 | $158,700 | $197,100 |
| 2019 | $9,345 | $336,400 | $158,700 | $177,700 |
| 2018 | $9,043 | $320,800 | $151,100 | $169,700 |
| 2017 | $8,850 | $313,400 | $151,100 | $162,300 |
| 2016 | $8,484 | $306,600 | $151,100 | $155,500 |
| 2015 | $8,385 | $281,000 | $124,700 | $156,300 |
| 2014 | $7,534 | $281,000 | $124,700 | $156,300 |
| 2013 | -- | $275,700 | $124,700 | $151,000 |
| 2012 | -- | $254,300 | $112,300 | $142,000 |
Source: Public Records
Map
Nearby Homes
- 157 Rumford St
- 30 Penacook St
- 25 N Spring St
- 7-9 Myrtle St
- 47 South St
- 441, 443 N State St
- 58 S State St
- 19 Grappone Dr
- 20 Carter St
- 28 Stevens Dr
- 0 South St Unit 4969509
- 5 Broad Ave
- 335 S Main St
- 34 Callaway Dr Unit 4
- 35 Callaway Dr Unit 6
- 17 Callaway Dr Unit 5
- 11 Eastman St
- 5 Ormond St
- 289 South St
- 22 Fairfield Dr
Your Personal Tour Guide
Ask me questions while you tour the home.