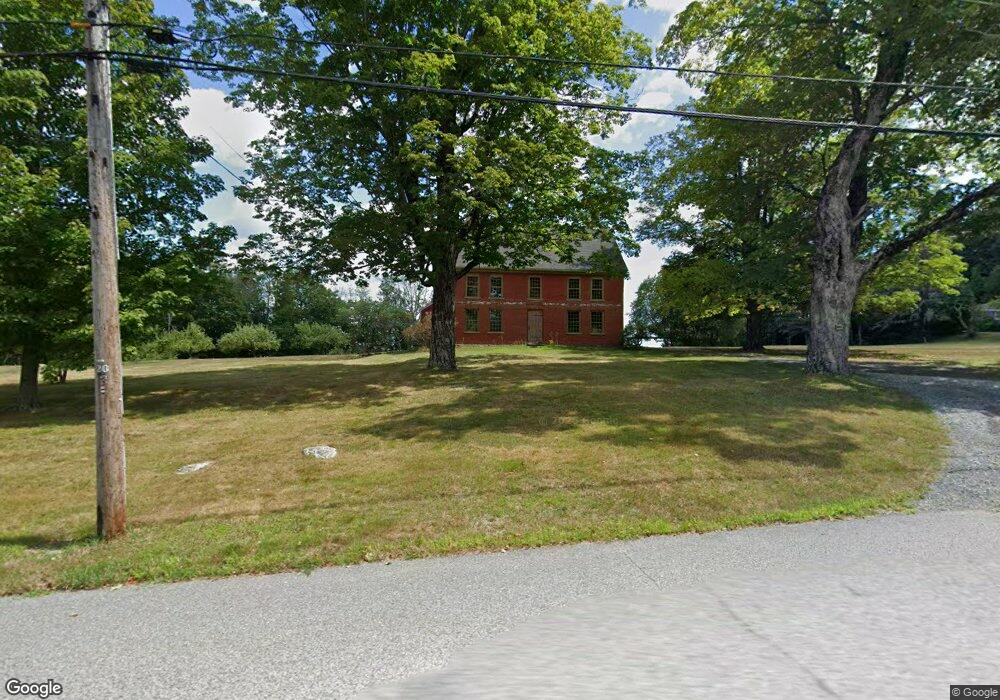
51 S Main St New Salem, MA 01355
New Salem NeighborhoodEstimated Value: $487,645 - $564,000
5
Beds
2
Baths
3,360
Sq Ft
$160/Sq Ft
Est. Value
About This Home
This home is located at 51 S Main St, New Salem, MA 01355 and is currently estimated at $537,411, approximately $159 per square foot. 51 S Main St is a home located in Franklin County with nearby schools including Swift River School and Ralph C Mahar Regional School.
Ownership History
Date
Name
Owned For
Owner Type
Purchase Details
Closed on
Jul 14, 2025
Sold by
Colby George E and Colby Ann
Bought by
51 S Main Rt and Barletta
Current Estimated Value
Purchase Details
Closed on
Aug 16, 1979
Bought by
Colby George E
Create a Home Valuation Report for This Property
The Home Valuation Report is an in-depth analysis detailing your home's value as well as a comparison with similar homes in the area
Home Values in the Area
Average Home Value in this Area
Purchase History
| Date | Buyer | Sale Price | Title Company |
|---|---|---|---|
| 51 S Main Rt | $550,000 | -- | |
| 51 S Main Rt | $550,000 | -- | |
| Colby George E | $48,000 | -- |
Source: Public Records
Mortgage History
| Date | Status | Borrower | Loan Amount |
|---|---|---|---|
| Previous Owner | Colby George E | $75,000 | |
| Previous Owner | Colby George E | $32,000 | |
| Previous Owner | Colby George E | $50,000 |
Source: Public Records
Tax History Compared to Growth
Tax History
| Year | Tax Paid | Tax Assessment Tax Assessment Total Assessment is a certain percentage of the fair market value that is determined by local assessors to be the total taxable value of land and additions on the property. | Land | Improvement |
|---|---|---|---|---|
| 2025 | $5,535 | $407,600 | $60,100 | $347,500 |
| 2024 | $5,716 | $397,800 | $78,400 | $319,400 |
| 2023 | $5,974 | $389,200 | $64,600 | $324,600 |
| 2022 | $6,418 | $339,200 | $64,600 | $274,600 |
| 2021 | $6,123 | $311,900 | $59,100 | $252,800 |
| 2020 | $5,627 | $311,900 | $59,100 | $252,800 |
| 2019 | $5,480 | $311,900 | $59,100 | $252,800 |
| 2018 | $5,446 | $300,400 | $57,300 | $243,100 |
| 2017 | $5,164 | $288,000 | $54,600 | $233,400 |
| 2016 | $4,962 | $288,000 | $54,600 | $233,400 |
| 2015 | $4,717 | $286,200 | $59,100 | $227,100 |
Source: Public Records
Map
Nearby Homes
- 72 N Main St
- 0 Wendell Rd
- Lot 55 Wendell Rd
- 63 Cooleyville Rd
- 0 Cooleyville Rd
- 2 Fay Rd
- Back Lot 0 Petersham Rd
- Lot 31 Wendell Rd
- 0 S Main St
- 28 Morse Village Rd
- 120 Horton Rd
- 610 S Main St
- 270 Holtshire Rd
- 4 West St
- 0 Shore Dr
- 84 Lake Dr
- 85 Lake Dr
- 248 Holtshire Rd Unit Lot 2
- 36 Merrill Dr
- 133 Lakeview Rd