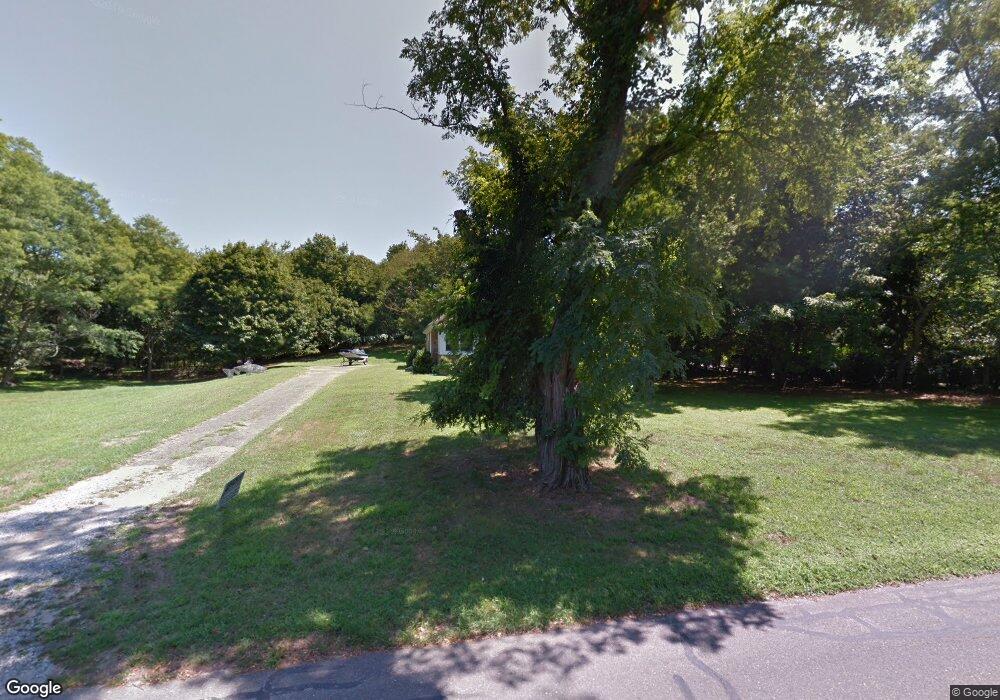
51 S Midway Rd Shelter Island, NY 11964
Estimated Value: $966,000 - $1,483,929
3
Beds
2
Baths
1,216
Sq Ft
$1,018/Sq Ft
Est. Value
About This Home
This home is located at 51 S Midway Rd, Shelter Island, NY 11964 and is currently estimated at $1,238,232, approximately $1,018 per square foot. 51 S Midway Rd is a home with nearby schools including Shelter Island School.
Ownership History
Date
Name
Owned For
Owner Type
Purchase Details
Closed on
May 2, 2003
Sold by
Conner Isabelle M
Bought by
Peacock Alexander S
Current Estimated Value
Home Financials for this Owner
Home Financials are based on the most recent Mortgage that was taken out on this home.
Original Mortgage
$400,000
Interest Rate
5.05%
Mortgage Type
Purchase Money Mortgage
Purchase Details
Closed on
May 18, 1998
Sold by
Saladino Peter F and Saladino Mary
Bought by
Conner Isabelle M
Home Financials for this Owner
Home Financials are based on the most recent Mortgage that was taken out on this home.
Original Mortgage
$196,000
Interest Rate
7.05%
Create a Home Valuation Report for This Property
The Home Valuation Report is an in-depth analysis detailing your home's value as well as a comparison with similar homes in the area
Home Values in the Area
Average Home Value in this Area
Purchase History
| Date | Buyer | Sale Price | Title Company |
|---|---|---|---|
| Peacock Alexander S | $500,000 | Fidelity National Title Ins | |
| Conner Isabelle M | $250,000 | The Title Guarantee Company |
Source: Public Records
Mortgage History
| Date | Status | Borrower | Loan Amount |
|---|---|---|---|
| Closed | Peacock Alexander S | $400,000 | |
| Closed | Conner Isabelle M | $196,000 |
Source: Public Records
Tax History Compared to Growth
Tax History
| Year | Tax Paid | Tax Assessment Tax Assessment Total Assessment is a certain percentage of the fair market value that is determined by local assessors to be the total taxable value of land and additions on the property. | Land | Improvement |
|---|---|---|---|---|
| 2024 | $4,042 | $634,000 | $434,000 | $200,000 |
| 2023 | $4,042 | $634,000 | $434,000 | $200,000 |
| 2022 | $3,991 | $634,000 | $434,000 | $200,000 |
| 2021 | $3,890 | $634,000 | $434,000 | $200,000 |
| 2020 | $3,819 | $627,000 | $434,000 | $193,000 |
| 2019 | $3,819 | $0 | $0 | $0 |
| 2018 | $3,678 | $624,000 | $490,100 | $133,900 |
| 2017 | $3,678 | $617,000 | $348,700 | $268,300 |
| 2016 | $3,649 | $599,000 | $332,200 | $266,800 |
| 2015 | -- | $579,000 | $380,400 | $198,600 |
| 2014 | -- | $576,000 | $380,400 | $195,600 |
Source: Public Records
Map
Nearby Homes