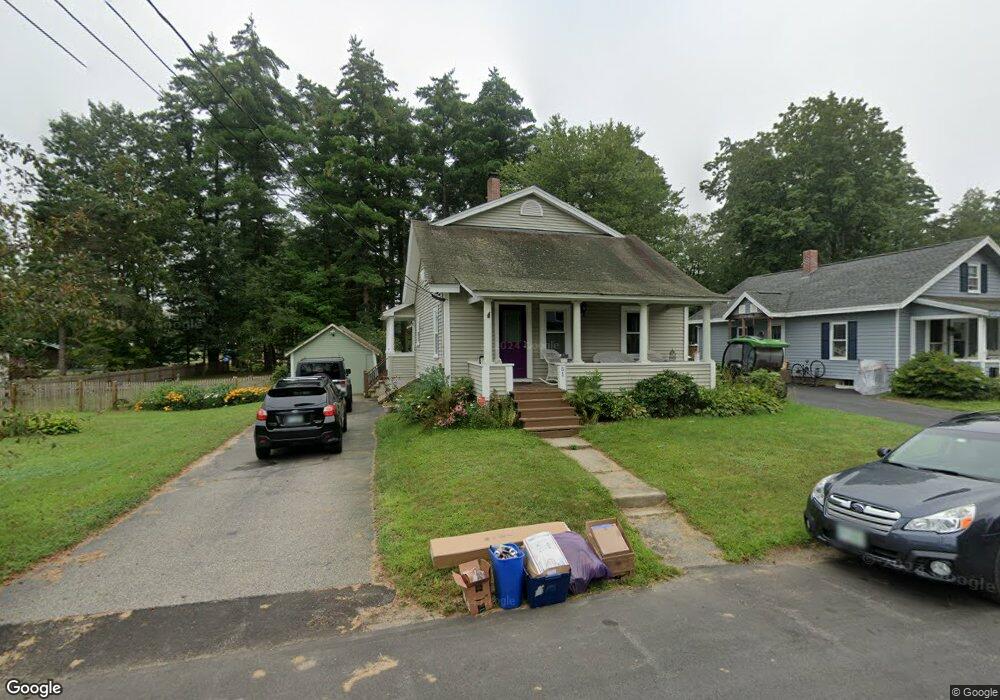
51 Stone St Concord, NH 03301
South End NeighborhoodEstimated Value: $473,287 - $536,000
4
Beds
3
Baths
2,083
Sq Ft
$240/Sq Ft
Est. Value
About This Home
This home is located at 51 Stone St, Concord, NH 03301 and is currently estimated at $499,572, approximately $239 per square foot. 51 Stone St is a home located in Merrimack County with nearby schools including Abbot-Downing School, Rundlett Middle School, and Concord High School.
Ownership History
Date
Name
Owned For
Owner Type
Purchase Details
Closed on
Feb 1, 2017
Sold by
Corcoran John W
Bought by
Halle-Corcoran Ellen F
Current Estimated Value
Purchase Details
Closed on
Jun 16, 1998
Sold by
Spain Richard A and Dawn Spain V
Bought by
Halle Ellen F
Home Financials for this Owner
Home Financials are based on the most recent Mortgage that was taken out on this home.
Original Mortgage
$64,600
Interest Rate
7.11%
Mortgage Type
Purchase Money Mortgage
Create a Home Valuation Report for This Property
The Home Valuation Report is an in-depth analysis detailing your home's value as well as a comparison with similar homes in the area
Home Values in the Area
Average Home Value in this Area
Purchase History
| Date | Buyer | Sale Price | Title Company |
|---|---|---|---|
| Halle-Corcoran Ellen F | -- | -- | |
| Halle Ellen F | $68,000 | -- |
Source: Public Records
Mortgage History
| Date | Status | Borrower | Loan Amount |
|---|---|---|---|
| Previous Owner | Halle Ellen F | $106,000 | |
| Previous Owner | Halle Ellen F | $64,600 |
Source: Public Records
Tax History
| Year | Tax Paid | Tax Assessment Tax Assessment Total Assessment is a certain percentage of the fair market value that is determined by local assessors to be the total taxable value of land and additions on the property. | Land | Improvement |
|---|---|---|---|---|
| 2025 | $8,238 | $283,000 | $121,800 | $161,200 |
| 2024 | $7,836 | $283,000 | $121,800 | $161,200 |
| 2023 | $7,601 | $283,000 | $121,800 | $161,200 |
| 2022 | $7,327 | $283,000 | $121,800 | $161,200 |
| 2021 | $7,109 | $283,000 | $121,800 | $161,200 |
| 2020 | $6,955 | $259,900 | $106,700 | $153,200 |
| 2019 | $6,553 | $235,900 | $106,700 | $129,200 |
| 2018 | $6,606 | $231,400 | $110,200 | $121,200 |
| 2017 | $6,357 | $225,100 | $108,300 | $116,800 |
| 2016 | $5,979 | $216,100 | $108,300 | $107,800 |
| 2015 | $5,780 | $208,300 | $101,600 | $106,700 |
| 2014 | $5,585 | $208,300 | $101,600 | $106,700 |
| 2013 | -- | $205,300 | $101,600 | $103,700 |
| 2012 | -- | $216,500 | $111,200 | $105,300 |
Source: Public Records
Map
Nearby Homes
- 0 South St Unit 4969509
- 335 S Main St
- 47 Noyes St
- 273-279 S Main St
- 33 Joffre St
- 47 South St
- 40 Nivelle St
- 289 South St
- 58 S State St
- 111 -113 South Main St
- 7-9 Myrtle St
- 30 Longmeadow Dr
- 25 N Spring St
- 22 Fairfield Dr
- 21 Fairfield Dr
- 20 Fairfield Dr
- 5 Holly Cir
- 5 Windchime Dr
- 19 Grappone Dr
- 13-15 Walker St
Your Personal Tour Guide
Ask me questions while you tour the home.