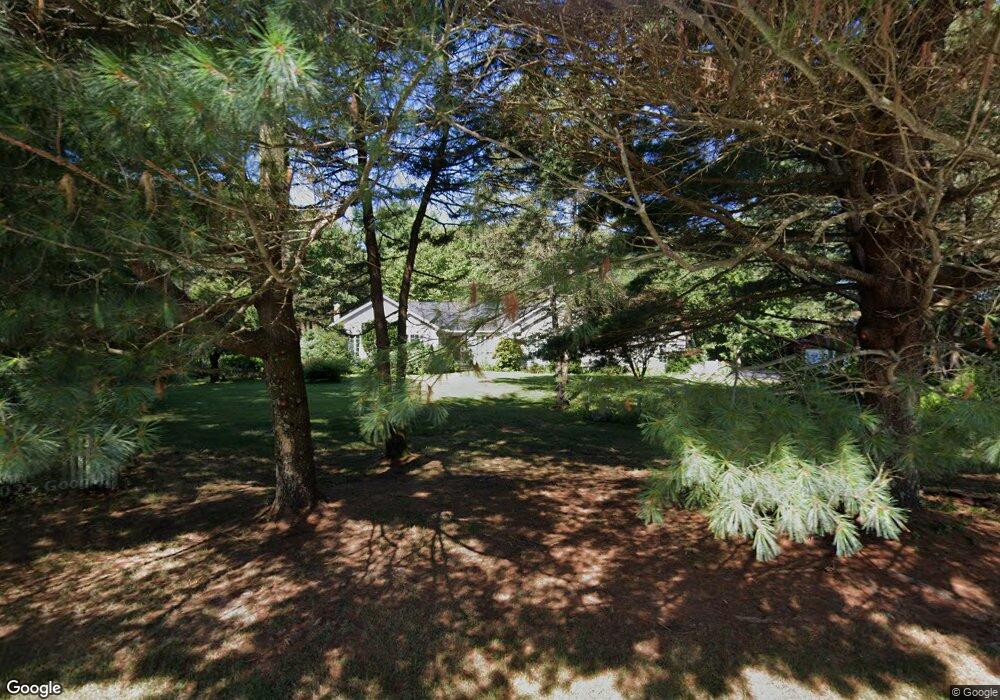
51 Straits Rd Hatfield, MA 01038
Estimated Value: $612,000 - $807,811
3
Beds
2
Baths
3,024
Sq Ft
$228/Sq Ft
Est. Value
About This Home
This home is located at 51 Straits Rd, Hatfield, MA 01038 and is currently estimated at $690,703, approximately $228 per square foot. 51 Straits Rd is a home located in Hampshire County with nearby schools including Hatfield Elementary School and Smith Academy.
Ownership History
Date
Name
Owned For
Owner Type
Purchase Details
Closed on
Apr 2, 2025
Sold by
Sheehan Marcia
Bought by
Marcia Sheehan Ret and Sheehan
Current Estimated Value
Purchase Details
Closed on
Nov 30, 2000
Sold by
Axler Mark
Bought by
Sheehan Eugene M and Sheehan Marcia J
Create a Home Valuation Report for This Property
The Home Valuation Report is an in-depth analysis detailing your home's value as well as a comparison with similar homes in the area
Home Values in the Area
Average Home Value in this Area
Purchase History
| Date | Buyer | Sale Price | Title Company |
|---|---|---|---|
| Marcia Sheehan Ret | -- | None Available | |
| Marcia Sheehan Ret | -- | None Available | |
| Sheehan Eugene M | $85,000 | -- | |
| Sheehan Eugene M | $85,000 | -- |
Source: Public Records
Mortgage History
| Date | Status | Borrower | Loan Amount |
|---|---|---|---|
| Previous Owner | Sheehan Eugene M | $150,000 | |
| Previous Owner | Sheehan Eugene M | $50,000 | |
| Previous Owner | Sheehan Eugene M | $264,000 |
Source: Public Records
Tax History
| Year | Tax Paid | Tax Assessment Tax Assessment Total Assessment is a certain percentage of the fair market value that is determined by local assessors to be the total taxable value of land and additions on the property. | Land | Improvement |
|---|---|---|---|---|
| 2025 | $10,268 | $741,900 | $175,300 | $566,600 |
| 2024 | $10,483 | $684,700 | $153,600 | $531,100 |
| 2023 | $8,731 | $647,700 | $145,400 | $502,300 |
| 2022 | $8,285 | $606,100 | $138,700 | $467,400 |
| 2021 | $7,993 | $563,300 | $127,400 | $435,900 |
| 2020 | $7,621 | $563,300 | $127,400 | $435,900 |
| 2019 | $7,410 | $533,500 | $125,200 | $408,300 |
| 2018 | $7,147 | $526,300 | $125,100 | $401,200 |
| 2017 | $6,980 | $528,000 | $125,100 | $402,900 |
| 2016 | $6,959 | $528,000 | $125,100 | $402,900 |
| 2015 | $6,871 | $521,700 | $113,800 | $407,900 |
| 2014 | $6,644 | $524,400 | $113,800 | $410,600 |
Source: Public Records
Map
Nearby Homes
- 59 N Hatfield Rd
- 0 Straits Rd
- 149 Prospect St
- 151 Pantry Rd
- 71 Chestnut St
- 58 Main St Unit 4
- 58 Main St Unit 3
- 18 Elm St
- 3 Frost Ln
- 8 Aloha Dr
- 14 Hawley Rd
- 43 Laurel Park Unit 43
- Lot 3 Roosevelt St
- 27 River Dr
- 6 Shattuck Rd
- 11 West St
- 32 Stonewall Dr
- 0 North St Unit 73407299
- 0 N Branch Rd
- 15 S Plain Rd
Your Personal Tour Guide
Ask me questions while you tour the home.