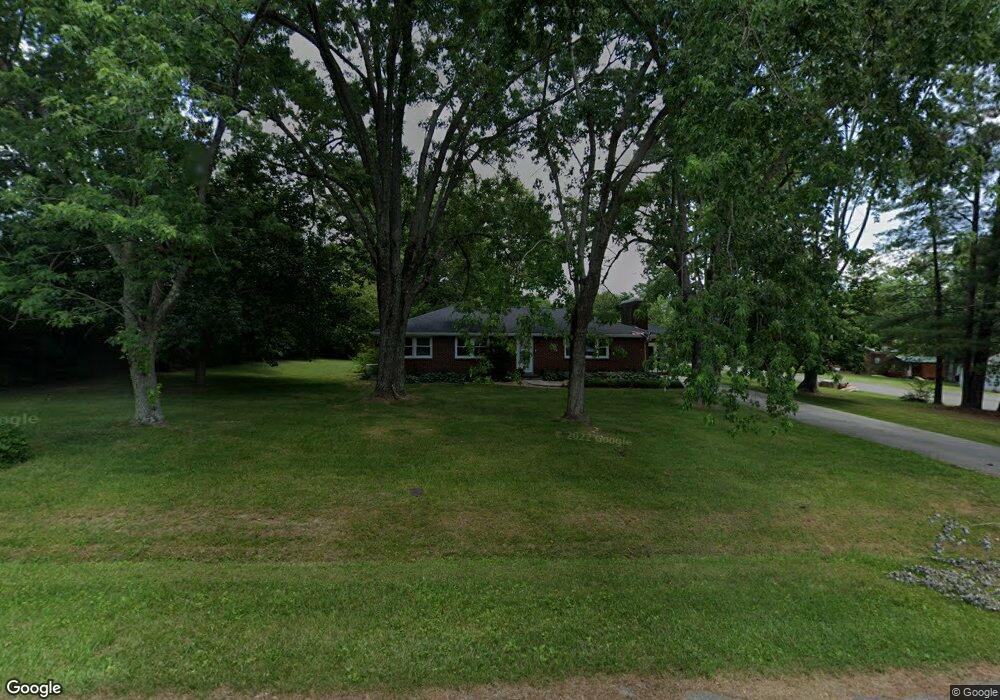
51 Woodcrest Blvd Manchester, TN 37355
Estimated Value: $176,967 - $245,000
--
Bed
2
Baths
1,533
Sq Ft
$144/Sq Ft
Est. Value
About This Home
This home is located at 51 Woodcrest Blvd, Manchester, TN 37355 and is currently estimated at $221,492, approximately $144 per square foot. 51 Woodcrest Blvd is a home located in Coffee County with nearby schools including Westwood Middle School and Temple Baptist Christian School.
Ownership History
Date
Name
Owned For
Owner Type
Purchase Details
Closed on
Jan 12, 2001
Current Estimated Value
Home Financials for this Owner
Home Financials are based on the most recent Mortgage that was taken out on this home.
Original Mortgage
$79,050
Outstanding Balance
$28,955
Interest Rate
7.44%
Estimated Equity
$192,537
Purchase Details
Closed on
Jan 12, 2000
Sold by
Stembel Michael
Bought by
Duncan Philliip and Duncan Stephani
Purchase Details
Closed on
Dec 16, 1999
Sold by
Stembel Michael M and Stembel Lisa R
Bought by
Adams Dewey K and Adams Eva P
Purchase Details
Closed on
Nov 4, 1998
Sold by
Stembel Michael and Stembel Lisa
Bought by
Stembel Michael M and Stembel Lisa R
Purchase Details
Closed on
Jul 27, 1998
Sold by
Vandergriff Chester
Bought by
Stembel Michael and Stembel Lisa
Create a Home Valuation Report for This Property
The Home Valuation Report is an in-depth analysis detailing your home's value as well as a comparison with similar homes in the area
Home Values in the Area
Average Home Value in this Area
Purchase History
| Date | Buyer | Sale Price | Title Company |
|---|---|---|---|
| -- | $77,600 | -- | |
| Duncan Philliip | $77,600 | -- | |
| Stembel Michael | -- | -- | |
| Adams Dewey K | $8,000 | -- | |
| Stembel Michael M | $7,000 | -- | |
| Stembel Michael | $70,000 | -- |
Source: Public Records
Mortgage History
| Date | Status | Borrower | Loan Amount |
|---|---|---|---|
| Open | Stembel Michael | $79,050 |
Source: Public Records
Tax History Compared to Growth
Tax History
| Year | Tax Paid | Tax Assessment Tax Assessment Total Assessment is a certain percentage of the fair market value that is determined by local assessors to be the total taxable value of land and additions on the property. | Land | Improvement |
|---|---|---|---|---|
| 2024 | $1,106 | $26,250 | $3,000 | $23,250 |
| 2023 | $1,106 | $26,250 | $0 | $0 |
| 2022 | $953 | $26,250 | $3,000 | $23,250 |
| 2021 | $946 | $20,675 | $2,500 | $18,175 |
| 2020 | $946 | $20,675 | $2,500 | $18,175 |
| 2019 | $946 | $20,675 | $2,500 | $18,175 |
| 2018 | $946 | $20,675 | $2,500 | $18,175 |
| 2017 | $1,017 | $19,400 | $2,500 | $16,900 |
| 2016 | $1,017 | $19,400 | $2,500 | $16,900 |
| 2015 | $1,018 | $19,400 | $2,500 | $16,900 |
| 2014 | $1,018 | $19,411 | $0 | $0 |
Source: Public Records
Map
Nearby Homes
- 207 Glenburg Dr
- 210 Rigney Dr
- 461 Hendrixson Dr
- 69 Laurel View St
- 23 Country Cir
- 37 Laurel View St
- 57 Laurel View St
- 47 Laurel View St
- 27 Laurel View St
- 54 Country Cir
- 287 Fredonia Rd
- 163 Stonehenge Ln
- 6 Fredonia Rd
- 3249 Fredonia Rd
- 62 Lakeview St
- 92 Lakeview St
- 475 Country Club Dr
- 1989 Elevation JKL Plan at Stonehenge
- 1726 Elevation JKL Plan at Stonehenge
- 1824 Elevation JKL Plan at Stonehenge
- 41 Edgewood Ct
- 273 Hendrixson Dr
- 22 Edgewood Ct
- 42 Woodcrest Blvd
- 237 Hendrixson Dr
- 61 Edgewood Ct
- 48 Edgewood Ct
- 20 Woodcrest Blvd
- 377 Glenburg Dr
- 407 Glenburg Dr
- 801 Sedgefield Ct
- 66 Edgewood Ct
- 100 Woodcrest Blvd
- 119 Woodcrest Blvd
- 325 Hendrixson Dr
- 209 Hendrixson Dr
- 800 Sedgefield Ct
- 238 Blakemore Rd
- 391 Walker St
- 316 Glenburg Dr