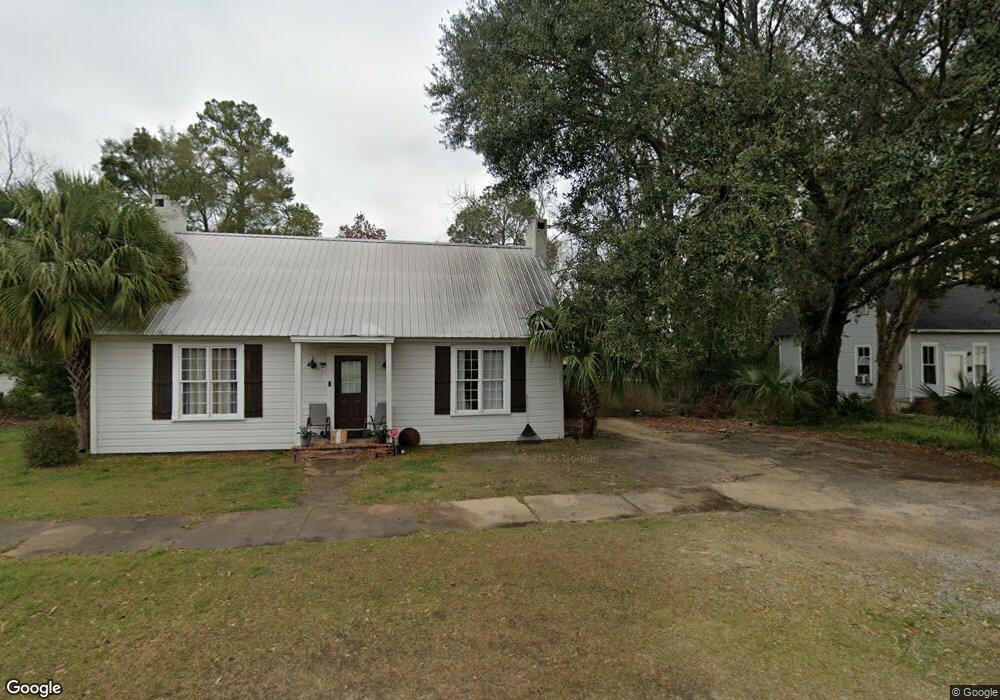
510 E Stephens St Unit 1 & 2 Quitman, GA 31643
Estimated Value: $59,000 - $92,443
2
Beds
2
Baths
1,730
Sq Ft
$45/Sq Ft
Est. Value
About This Home
This home is located at 510 E Stephens St Unit 1 & 2, Quitman, GA 31643 and is currently estimated at $78,481, approximately $45 per square foot. 510 E Stephens St Unit 1 & 2 is a home located in Brooks County with nearby schools including Quitman Elementary School and First Baptist Church Preschool & Kindergarten.
Ownership History
Date
Name
Owned For
Owner Type
Purchase Details
Closed on
Sep 13, 2019
Sold by
Bh Properties Llc
Bought by
Ramraj Adesh I and Ramraj Kimberly C
Current Estimated Value
Purchase Details
Closed on
Nov 16, 2015
Sold by
Citizens National Bank Of
Bought by
Bh Properties Llc
Purchase Details
Closed on
Jan 8, 2015
Sold by
Deallaume Edward J
Bought by
Citizens National Bank
Purchase Details
Closed on
Sep 20, 2011
Sold by
Edwing Maryann T
Bought by
Deallaume Edward J
Purchase Details
Closed on
Oct 30, 2008
Sold by
Deallaume Edward J
Bought by
Edwing Maryann T
Purchase Details
Closed on
Sep 2, 2004
Sold by
Mccard Jack
Bought by
Deallaume Edward J
Purchase Details
Closed on
Nov 1, 1996
Sold by
Mccard Doris H
Bought by
Mccard Jack
Purchase Details
Closed on
Jul 24, 1981
Sold by
Wheeler Joseph E
Bought by
Mccard Doris H
Create a Home Valuation Report for This Property
The Home Valuation Report is an in-depth analysis detailing your home's value as well as a comparison with similar homes in the area
Home Values in the Area
Average Home Value in this Area
Purchase History
| Date | Buyer | Sale Price | Title Company |
|---|---|---|---|
| Ramraj Adesh I | $35,000 | -- | |
| Bh Properties Llc | $22,000 | -- | |
| Citizens National Bank | $106,560 | -- | |
| Deallaume Edward J | $110,000 | -- | |
| Edwing Maryann T | -- | -- | |
| Deallaume Edward J | $225,000 | -- | |
| Mccard Jack | $60,000 | -- | |
| Mccard Doris H | -- | -- |
Source: Public Records
Mortgage History
| Date | Status | Borrower | Loan Amount |
|---|---|---|---|
| Closed | Deallaume Edward J | -- |
Source: Public Records
Tax History Compared to Growth
Tax History
| Year | Tax Paid | Tax Assessment Tax Assessment Total Assessment is a certain percentage of the fair market value that is determined by local assessors to be the total taxable value of land and additions on the property. | Land | Improvement |
|---|---|---|---|---|
| 2024 | $1,052 | $32,160 | $2,120 | $30,040 |
| 2023 | $1,029 | $29,080 | $2,120 | $26,960 |
| 2022 | $567 | $16,080 | $2,080 | $14,000 |
| 2021 | $494 | $14,000 | $2,080 | $11,920 |
| 2020 | $508 | $14,400 | $2,080 | $12,320 |
| 2019 | $443 | $14,560 | $2,840 | $11,720 |
| 2018 | $529 | $14,560 | $2,840 | $11,720 |
| 2017 | $432 | $14,000 | $2,960 | $11,040 |
| 2016 | $269 | $14,400 | $2,960 | $11,440 |
| 2015 | -- | $16,080 | $2,960 | $13,120 |
| 2014 | -- | $16,080 | $2,960 | $13,120 |
| 2013 | -- | $16,080 | $2,960 | $13,120 |
Source: Public Records
Map
Nearby Homes
- 000 E Gordon St
- 503 N Culpepper St
- 606 N Court St
- 621 N Court St
- 1306 E Screven St
- 304 W Rountree St
- 84 W Us
- 802 W Lafayette St
- 602 N Webster St
- 1002 N Madison St
- 1103 W Railroad St
- 714 Morris Ave
- 309 Eastlake Dr
- 5616 Empress Rd
- 804 Westlake Dr
- 302 Waterside Dr
- 2434 Dunn Rd
- 1540 Dunn Rd
- 7747 Empress Rd
- 237 Turkey Ridge Ln
- 510 E Stephens St
- 206 N Clay St
- 504 E Stephens St
- 203 N Clay St
- 501 E Lafayette St
- 209 N Clay St
- 404 E Stephens St
- 301 N Jefferson St
- 303 N Clay St
- 504 E Lafayette St
- 608 E Lafayette St
- 0 U S 84
- N/A U S 84
- 302 E Lafayette St
- 209 N Washington St
- 309 N Culpepper St
- 309 N Jefferson St
- 614 E Lafayette St
- 702 E Stephens St
- 307 N Clay St