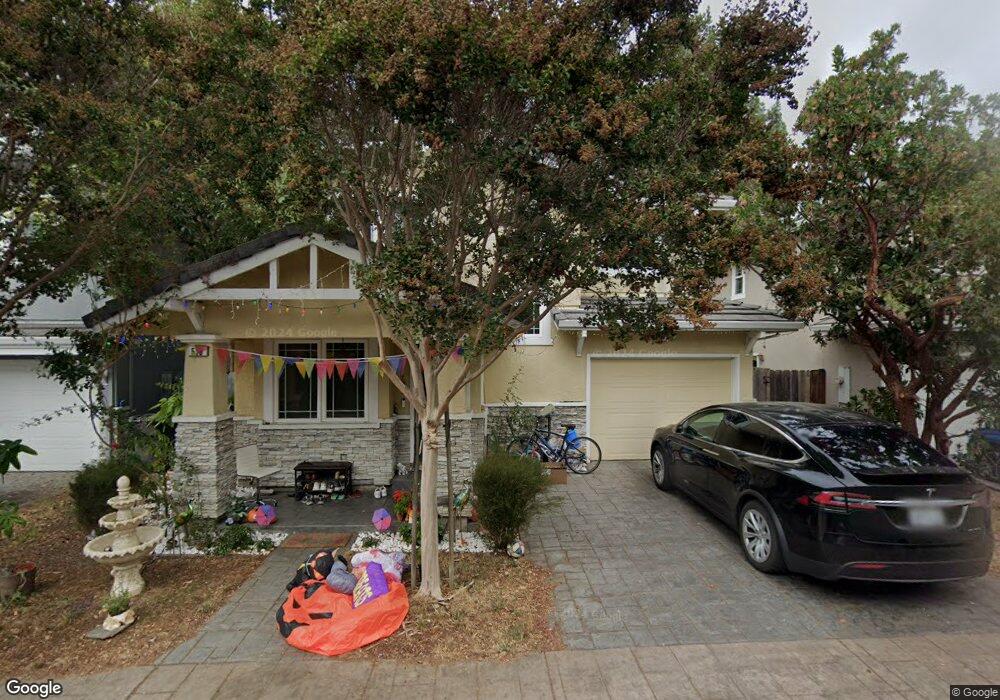
510 Rathmore Ln Mountain View, CA 94043
Whisman NeighborhoodEstimated Value: $2,135,000 - $2,666,000
3
Beds
3
Baths
1,893
Sq Ft
$1,205/Sq Ft
Est. Value
About This Home
This home is located at 510 Rathmore Ln, Mountain View, CA 94043 and is currently estimated at $2,281,146, approximately $1,205 per square foot. 510 Rathmore Ln is a home located in Santa Clara County with nearby schools including Amy Imai Elementary School, Crittenden Middle School, and Mountain View High School.
Ownership History
Date
Name
Owned For
Owner Type
Purchase Details
Closed on
Jul 18, 2013
Sold by
Jain Radhika R and Jain Rajeev
Bought by
Jain Radhika R and Jain Rajeev
Current Estimated Value
Home Financials for this Owner
Home Financials are based on the most recent Mortgage that was taken out on this home.
Original Mortgage
$655,000
Outstanding Balance
$441,008
Interest Rate
2.25%
Mortgage Type
New Conventional
Estimated Equity
$1,840,138
Purchase Details
Closed on
Sep 21, 2012
Sold by
Yang Kailin
Bought by
Jain Radhinka R and Jain Rajeev
Home Financials for this Owner
Home Financials are based on the most recent Mortgage that was taken out on this home.
Original Mortgage
$662,400
Interest Rate
2.87%
Mortgage Type
FHA
Purchase Details
Closed on
Oct 14, 2004
Sold by
Murlagan Llc
Bought by
Yang Kailin
Home Financials for this Owner
Home Financials are based on the most recent Mortgage that was taken out on this home.
Original Mortgage
$631,200
Interest Rate
2.25%
Mortgage Type
Negative Amortization
Create a Home Valuation Report for This Property
The Home Valuation Report is an in-depth analysis detailing your home's value as well as a comparison with similar homes in the area
Home Values in the Area
Average Home Value in this Area
Purchase History
| Date | Buyer | Sale Price | Title Company |
|---|---|---|---|
| Jain Radhika R | -- | Members Title Company | |
| Jain Radhinka R | $720,000 | Chicago Title Company | |
| Yang Kailin | $789,000 | Old Republic Title Company |
Source: Public Records
Mortgage History
| Date | Status | Borrower | Loan Amount |
|---|---|---|---|
| Open | Jain Radhika R | $655,000 | |
| Closed | Jain Radhinka R | $662,400 | |
| Previous Owner | Yang Kailin | $631,200 | |
| Closed | Yang Kailin | $78,850 |
Source: Public Records
Tax History Compared to Growth
Tax History
| Year | Tax Paid | Tax Assessment Tax Assessment Total Assessment is a certain percentage of the fair market value that is determined by local assessors to be the total taxable value of land and additions on the property. | Land | Improvement |
|---|---|---|---|---|
| 2025 | $10,304 | $886,615 | $709,297 | $177,318 |
| 2024 | $10,304 | $869,232 | $695,390 | $173,842 |
| 2023 | $10,197 | $852,189 | $681,755 | $170,434 |
| 2022 | $10,167 | $835,481 | $668,388 | $167,093 |
| 2021 | $9,919 | $819,100 | $655,283 | $163,817 |
| 2020 | $9,931 | $810,702 | $648,564 | $162,138 |
| 2019 | $9,515 | $794,807 | $635,848 | $158,959 |
| 2018 | $9,417 | $779,224 | $623,381 | $155,843 |
| 2017 | $9,029 | $763,946 | $611,158 | $152,788 |
| 2016 | $8,750 | $748,968 | $599,175 | $149,793 |
| 2015 | $8,499 | $737,718 | $590,175 | $147,543 |
| 2014 | $8,421 | $723,268 | $578,615 | $144,653 |
Source: Public Records
Map
Nearby Homes
- 175 Evandale Ave Unit 2
- 530 Devonshire Ct
- 248 Walker Dr Unit 2
- 99 Sherland Ave Unit B
- 94 Flynn Ave Unit D
- 139 Flynn Ave
- 149 Flynn Ave
- 90 Flynn Ave Unit C
- 110 E Middlefield Rd Unit C
- 647 Alamo Ct
- 280 Easy St Unit 311
- 198 Ada Ave
- 163 Gladys Ave
- 71 Gladys Ave
- 751 San Pablo Dr
- 201 Ada Ave Unit 25
- 3418 Pyramid Way
- 125 Orbit Way
- 876 San Simeon Dr
- 280 Orchard Ave Unit K
- 520 Rathmore Ln
- 242 Murlagan Ave
- 226 Murlagan Ave
- 75 Devonshire Ave
- 75 Devonshire Ave Unit 4
- 75 Devonshire Ave Unit 3
- 75 Devonshire Ave Unit 2
- 75 Devonshire Ave Unit 1
- 75 Devonshire Ave Unit 9
- 75 Devonshire Ave Unit 8
- 75 Devonshire Ave Unit 7
- 75 Devonshire Ave Unit 6
- 75 Devonshire Ave Unit 5
- 233 Murlagan Ave
- 274 Murlagan Ave
- 239 Murlagan Ave
- 77 Devonshire Ave
- 225 Murlagan Ave
- 81 Devonshire Ave Unit 11
- 81 Devonshire Ave Unit 10