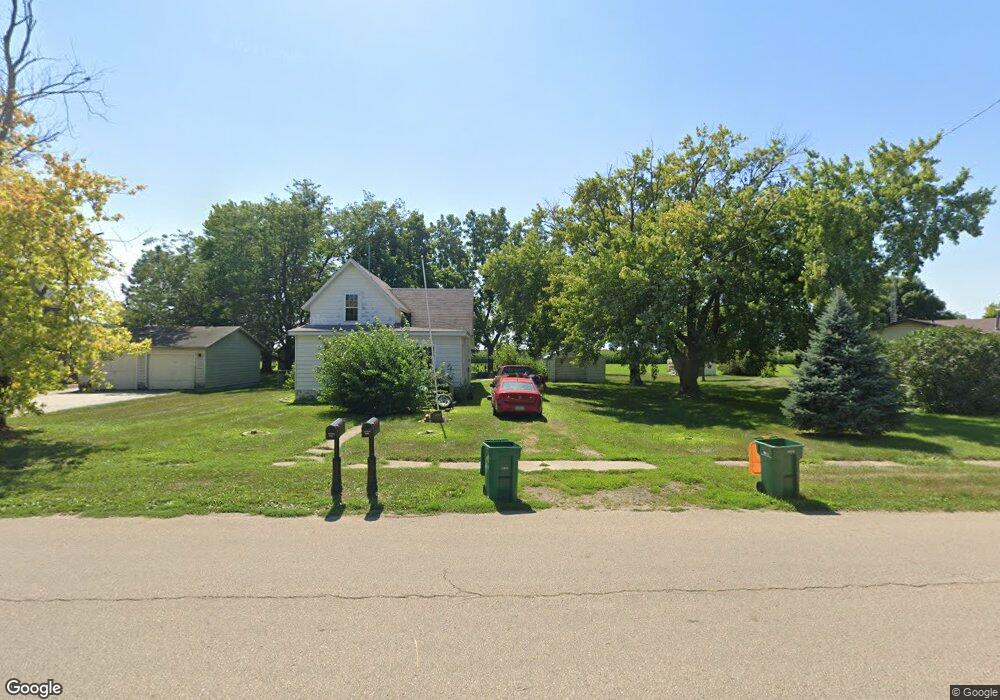
510 SE Elm St Corwith, IA 50430
Estimated Value: $39,000 - $81,000
4
Beds
1
Bath
1,549
Sq Ft
$35/Sq Ft
Est. Value
About This Home
This home is located at 510 SE Elm St, Corwith, IA 50430 and is currently estimated at $54,783, approximately $35 per square foot. 510 SE Elm St is a home located in Hancock County with nearby schools including Bertha Godfrey Elementary School, Lucia Wallace Elementary School, and Bryant Elementary School.
Ownership History
Date
Name
Owned For
Owner Type
Purchase Details
Closed on
Jan 2, 2013
Sold by
River City Home Improvements Inc
Bought by
Richardson Ginette A
Current Estimated Value
Purchase Details
Closed on
May 14, 2012
Sold by
Henke Dustin
Bought by
River City Home Improvements
Purchase Details
Closed on
Jun 18, 2008
Sold by
Grand River Investors L Lc
Bought by
Henke Dustin Alex
Purchase Details
Closed on
May 2, 2008
Sold by
Adair Holding L L C
Bought by
Grand River Investors L L C
Purchase Details
Closed on
Feb 8, 2006
Sold by
Bell Jean
Bought by
Adair Holdings Llc
Create a Home Valuation Report for This Property
The Home Valuation Report is an in-depth analysis detailing your home's value as well as a comparison with similar homes in the area
Home Values in the Area
Average Home Value in this Area
Purchase History
| Date | Buyer | Sale Price | Title Company |
|---|---|---|---|
| Richardson Ginette A | $22,000 | None Available | |
| River City Home Improvements | $445 | None Available | |
| Henke Dustin Alex | $5,500 | Best Abstract & Title Compan | |
| Grand River Investors L L C | $4,500 | None Available | |
| Adair Holdings Llc | $229 | None Available |
Source: Public Records
Tax History Compared to Growth
Tax History
| Year | Tax Paid | Tax Assessment Tax Assessment Total Assessment is a certain percentage of the fair market value that is determined by local assessors to be the total taxable value of land and additions on the property. | Land | Improvement |
|---|---|---|---|---|
| 2025 | $280 | $27,720 | $4,240 | $23,480 |
| 2024 | $280 | $27,090 | $4,240 | $22,850 |
| 2023 | $272 | $27,090 | $4,240 | $22,850 |
| 2022 | $0 | $26,730 | $4,240 | $22,490 |
| 2021 | $0 | $28,200 | $4,240 | $23,960 |
| 2020 | $0 | $27,100 | $4,240 | $22,860 |
| 2019 | $524 | $27,100 | $4,240 | $22,860 |
| 2018 | $514 | $30,350 | $4,240 | $26,110 |
| 2017 | $514 | $28,570 | $0 | $0 |
| 2016 | $476 | $28,570 | $0 | $0 |
| 2015 | $476 | $29,210 | $0 | $0 |
| 2014 | $472 | $29,210 | $0 | $0 |
Source: Public Records
Map
Nearby Homes
- 512 SE Elm St
- 504 SE Elm St
- 514 SE Elm St
- 511 SE Elm St
- 516 SE Elm St
- 505 SE Elm St
- 520 SE Elm St
- 517 SE Elm St
- 222 Blvd Saint Louis
- 224 Saint Louis Blvd
- 522 SE Elm St
- 522 SE Elm St
- 521 SE Elm St
- 113 Saint Louis Blvd
- 409 SE Elm St
- 222 Saint Louis Blvd
- 107 Saint Louis Blvd
- 112 Saint Louis Blvd
- 112 Saint Louis Blvd
- 523 SE Elm St