Estimated Value: $67,000 - $176,000
3
Beds
2
Baths
1,200
Sq Ft
$112/Sq Ft
Est. Value
About This Home
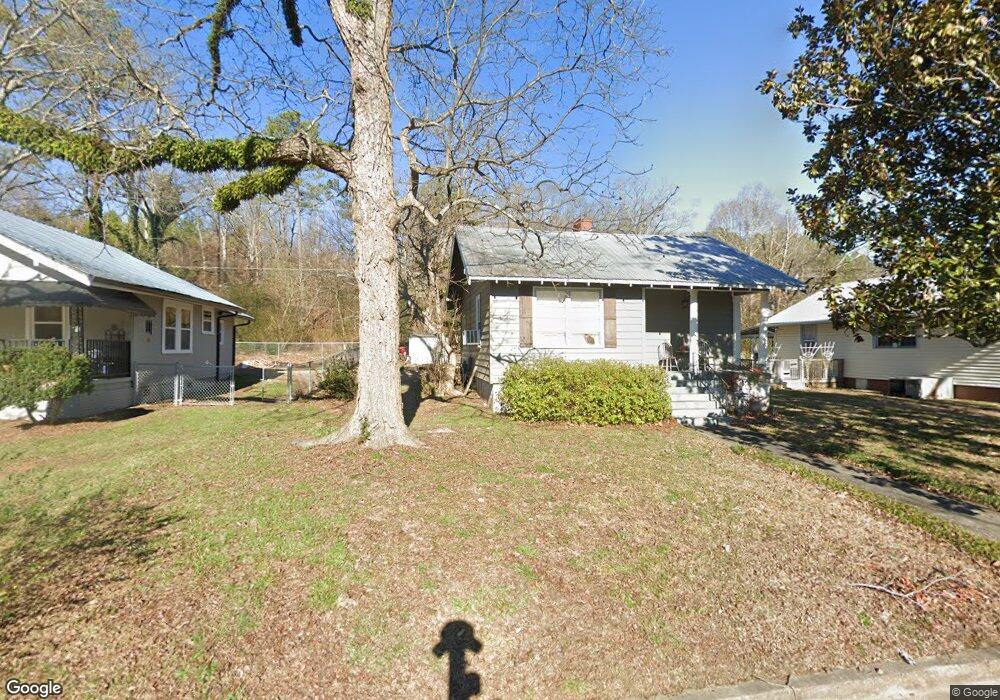
This home is located at 510 Third St, Rome, GA 30161 and is currently estimated at $134,000, approximately $111 per square foot. 510 Third St is a home located in Floyd County with nearby schools including Model Middle School and Model High School.
Ownership History
Date
Name
Owned For
Owner Type
Purchase Details
Closed on
Dec 21, 2018
Sold by
Jones Nicholas Adam
Bought by
Jones Nicholas Adam and Jones Rachelle Abigail
Current Estimated Value
Home Financials for this Owner
Home Financials are based on the most recent Mortgage that was taken out on this home.
Original Mortgage
$61,363
Outstanding Balance
$54,062
Interest Rate
4.8%
Mortgage Type
New Conventional
Estimated Equity
$79,938
Purchase Details
Closed on
Mar 19, 2018
Sold by
Baugher Michael Charles Es
Bought by
The Landlord Inc
Purchase Details
Closed on
Aug 12, 2008
Sold by
Not Provided
Bought by
Baugher Michael C and Baugher Christina S
Purchase Details
Closed on
May 6, 2008
Sold by
Not Provided
Bought by
Baugher Michael C and Baugher Christina S
Purchase Details
Closed on
Jul 28, 1991
Sold by
Griffin J R
Bought by
Allen Marion Denice
Purchase Details
Closed on
Jan 1, 1987
Bought by
P and R
Purchase Details
Closed on
Jul 21, 1961
Bought by
Griffin J R
Create a Home Valuation Report for This Property
The Home Valuation Report is an in-depth analysis detailing your home's value as well as a comparison with similar homes in the area
Home Values in the Area
Average Home Value in this Area
Purchase History
| Date | Buyer | Sale Price | Title Company |
|---|---|---|---|
| Jones Nicholas Adam | -- | -- | |
| The Landlord Inc | $18,000 | -- | |
| Baugher Michael C | $30,000 | -- | |
| Baugher Michael C | $30,000 | -- | |
| Baugher Michael C | $38,000 | -- | |
| Us Bank National Association | $38,000 | -- | |
| Allen Marion Denice | $23,000 | -- | |
| P | -- | -- | |
| Griffin J R | -- | -- |
Source: Public Records
Mortgage History
| Date | Status | Borrower | Loan Amount |
|---|---|---|---|
| Open | Jones Nicholas Adam | $61,363 |
Source: Public Records
Tax History Compared to Growth
Tax History
| Year | Tax Paid | Tax Assessment Tax Assessment Total Assessment is a certain percentage of the fair market value that is determined by local assessors to be the total taxable value of land and additions on the property. | Land | Improvement |
|---|---|---|---|---|
| 2024 | $947 | $41,790 | $3,802 | $37,988 |
| 2023 | $948 | $40,899 | $3,379 | $37,520 |
| 2022 | $858 | $34,452 | $2,746 | $31,706 |
| 2021 | $746 | $27,641 | $2,746 | $24,895 |
| 2020 | $722 | $26,159 | $2,112 | $24,047 |
| 2019 | $657 | $25,186 | $2,112 | $23,074 |
| 2018 | $432 | $13,309 | $2,112 | $11,197 |
| 2017 | $427 | $13,104 | $2,112 | $10,992 |
| 2016 | $475 | $14,500 | $2,080 | $12,420 |
| 2015 | $522 | $14,820 | $2,080 | $12,740 |
| 2014 | $522 | $14,820 | $2,080 | $12,740 |
Source: Public Records
Map
Nearby Homes
- 445 Old Shannon Rd NE
- 430 Third St
- 635 E 3rd St
- 320 Shannon Rd NE
- 255 E 2nd St NE
- 4th Shannon Cir NE
- 45 4th - Shannon St
- 50 Round Rock Cir NE
- 13 Granite Way NE
- 6 Keystone Ln NE
- 320 Old Shannon Rd NE
- 195 Shannon Rd NE
- 00 Todd St NE
- 0 Pierce Hill Rd NE Unit 10586571
- 129 Pierce Hill Rd NE
- 35 Old Shannon Rd NE
- 445 2nd Shannon St
- 1055 E Hermitage Rd NE
- 107 Winsome Place NE
- 16 Cinnamon Ln NE
- 510 E 3rd St
- 520 Third St
- 530 Third St
- 505 E 3rd St
- 505 3rd St Shannon
- 505 3rd St
- 525 E 3rd St
- 470 Third St
- 540 E 3rd Shannon St
- 535 3rd - Shannon St
- 475 E 3rd St
- 460 3rd St Shannon
- 550 E 3rd Shannon St
- 545 NE 3rd St NE
- 545 3rd Shannon St
- 545 E 3rd St
- 510 2nd St NE
- 560 E 3rd Shannon St
- 465 4th St
- 450 3rd St Ne Shannon