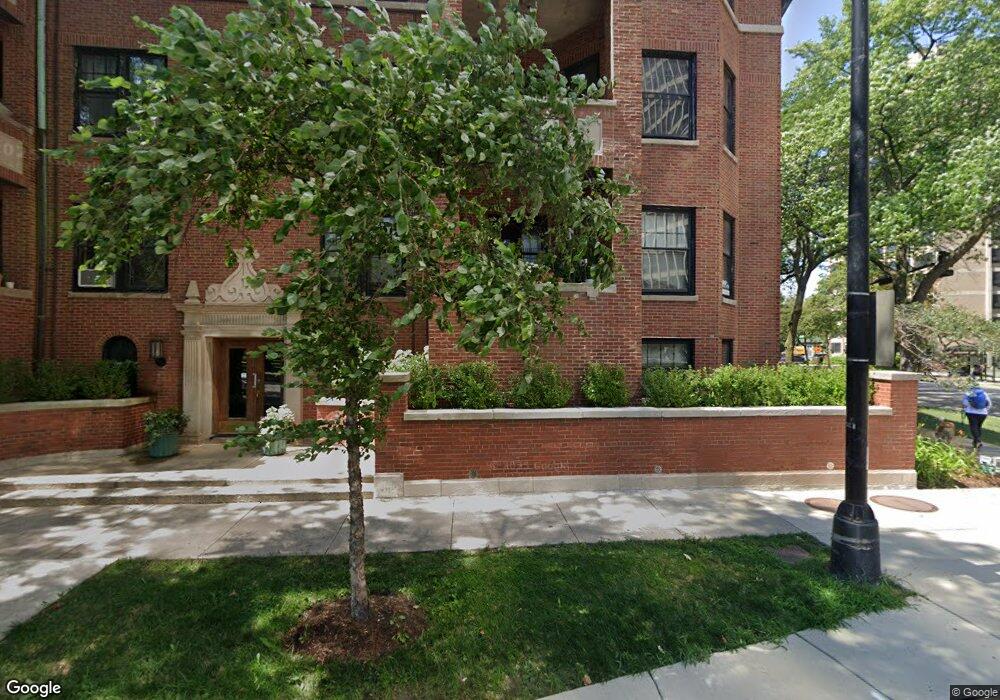
5100 S Hyde Park Blvd Unit 1627 Chicago, IL 60615
Hyde Park NeighborhoodEstimated Value: $310,000 - $341,348
--
Bed
--
Bath
--
Sq Ft
1.01
Acres
About This Home
This home is located at 5100 S Hyde Park Blvd Unit 1627, Chicago, IL 60615 and is currently estimated at $328,587. 5100 S Hyde Park Blvd Unit 1627 is a home located in Cook County with nearby schools including Harte Elementary School, Kenwood Academy High School, and Akiba-Schechter Jewish Day School.
Ownership History
Date
Name
Owned For
Owner Type
Purchase Details
Closed on
May 19, 2022
Sold by
Schoeder Francis H and Brueni Bonnie Lee
Bought by
Bonnie L Brueni Trust and Francis H Schoeder Trust
Current Estimated Value
Purchase Details
Closed on
Oct 3, 2003
Sold by
Brueni Bonnie Lee
Bought by
Schoederl Francis H and Brueni Bonnie Lee
Home Financials for this Owner
Home Financials are based on the most recent Mortgage that was taken out on this home.
Original Mortgage
$240,000
Interest Rate
6.49%
Mortgage Type
Stand Alone First
Purchase Details
Closed on
Jul 26, 1996
Sold by
Makaveskis David J and Makaveskis Zosima P
Bought by
Jorgensen William P and Jorgensen Theresa Ann
Home Financials for this Owner
Home Financials are based on the most recent Mortgage that was taken out on this home.
Original Mortgage
$92,750
Interest Rate
8.43%
Mortgage Type
Commercial
Create a Home Valuation Report for This Property
The Home Valuation Report is an in-depth analysis detailing your home's value as well as a comparison with similar homes in the area
Home Values in the Area
Average Home Value in this Area
Purchase History
| Date | Buyer | Sale Price | Title Company |
|---|---|---|---|
| Bonnie L Brueni Trust | -- | None Listed On Document | |
| Schoederl Francis H | -- | Residential Title Services | |
| Jorgensen William P | $18,000 | -- |
Source: Public Records
Mortgage History
| Date | Status | Borrower | Loan Amount |
|---|---|---|---|
| Previous Owner | Schoederl Francis H | $240,000 | |
| Previous Owner | Jorgensen William P | $92,750 |
Source: Public Records
Tax History Compared to Growth
Tax History
| Year | Tax Paid | Tax Assessment Tax Assessment Total Assessment is a certain percentage of the fair market value that is determined by local assessors to be the total taxable value of land and additions on the property. | Land | Improvement |
|---|---|---|---|---|
| 2024 | $5,862 | $34,208 | $8,318 | $25,890 |
| 2023 | $5,672 | $31,000 | $6,708 | $24,292 |
| 2022 | $5,672 | $31,000 | $6,708 | $24,292 |
| 2021 | $5,564 | $30,999 | $6,707 | $24,292 |
| 2020 | $4,108 | $21,542 | $5,366 | $16,176 |
| 2019 | $4,024 | $23,456 | $5,366 | $18,090 |
| 2018 | $3,955 | $23,456 | $5,366 | $18,090 |
| 2017 | $3,545 | $19,841 | $4,427 | $15,414 |
| 2016 | $3,474 | $19,841 | $4,427 | $15,414 |
| 2015 | $3,155 | $19,841 | $4,427 | $15,414 |
| 2014 | $4,051 | $24,402 | $3,622 | $20,780 |
| 2013 | $3,960 | $24,402 | $3,622 | $20,780 |
Source: Public Records
Map
Nearby Homes
- 1615 E Hyde Park Blvd Unit 2
- 5100 S Hyde Park Blvd Unit 1B
- 5050 S East End Ave Unit 4B
- 5050 S East End Ave Unit 7A
- 5050 S East End Ave Unit 2D
- 5050 S East End Ave Unit 7D
- 5201 S Cornell Ave Unit 27D
- 5201 S Cornell Ave Unit 20E
- 5201 S Cornell Ave Unit 4B
- 5000 S East End Ave Unit 18C
- 5000 S East End Ave Unit 2D
- 5000 S East End Ave Unit 13A
- 5000 S East End Ave Unit 24A
- 5000 S East End Ave Unit 23A
- 5000 S Cornell Ave Unit 3A
- 5000 S Cornell Ave Unit 6C
- 1640 E 50th St Unit 13B
- 4940 S East End Ave Unit 2C
- 5300 S Shore Dr Unit 111
- 5300 S Shore Dr Unit 59
- 1627 E Hyde Park Blvd Unit 3
- 1615 E Hyde Park Blvd Unit 3
- 5100 S Hyde Park Blvd Unit G
- 5100 S Hyde Park Blvd Unit 5100
- 5100 S Hyde Park Blvd Unit 5100
- 5100 S Hyde Park Blvd Unit 5100
- 5100 S Hyde Park Blvd Unit 1617
- 5100 S Hyde Park Blvd Unit 5100
- 5100 S Hyde Park Blvd Unit 1621
- 5100 S Hyde Park Blvd Unit 1635
- 1629 E Hyde Park Blvd Unit 1629
- 5100 S Hyde Park Blvd Unit 1627
- 1615 E Hyde Park Blvd Unit 1615
- 5100 S Hyde Park Blvd Unit 5109
- 5100 S Hyde Park Blvd Unit 5100
- 5100 S Hyde Park Blvd Unit 5100
- 1629 E Hyde Park Blvd Unit 1629
- 5100 S Hyde Park Blvd Unit 5100
- 5100 S Hyde Park Blvd Unit 5100
- 1615 E Hyde Park Blvd Unit 1615