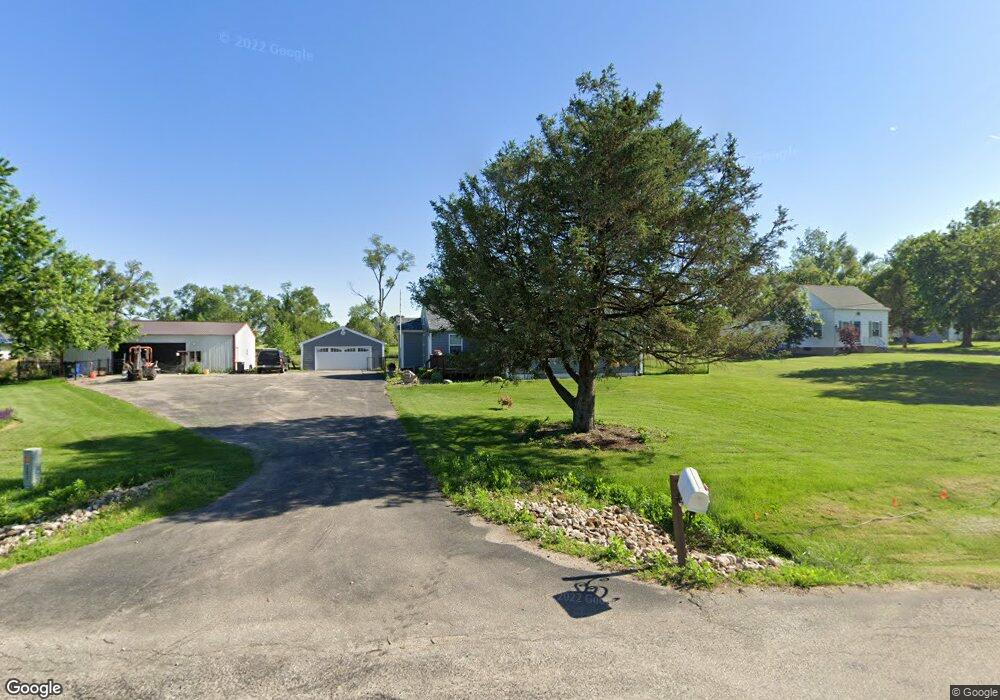
5101 Ely Rd SW Cedar Rapids, IA 52404
Southwest Area NeighborhoodEstimated Value: $231,000 - $336,000
2
Beds
1
Bath
1,300
Sq Ft
$219/Sq Ft
Est. Value
About This Home
This home is located at 5101 Ely Rd SW, Cedar Rapids, IA 52404 and is currently estimated at $284,780, approximately $219 per square foot. 5101 Ely Rd SW is a home located in Linn County with nearby schools including Prairie Heights Elementary School, Prairie View Elementary School, and Prairie Crest Elementary School.
Ownership History
Date
Name
Owned For
Owner Type
Purchase Details
Closed on
Mar 31, 2011
Sold by
Ahsure Investments Llc
Bought by
Mart David L and Mart Tracy L
Current Estimated Value
Home Financials for this Owner
Home Financials are based on the most recent Mortgage that was taken out on this home.
Original Mortgage
$178,125
Outstanding Balance
$124,260
Interest Rate
5.04%
Mortgage Type
New Conventional
Estimated Equity
$160,520
Purchase Details
Closed on
Jul 23, 2010
Sold by
Secretary Of The Department Of Veteran A
Bought by
Ahsure Investments Llc
Purchase Details
Closed on
Aug 5, 2009
Sold by
Nationwide Advantage Mortgage Company
Bought by
Administrator Of Veterans Affairs
Purchase Details
Closed on
Jul 28, 2009
Sold by
Bolin Kevin E
Bought by
Nationwide Advantage Mortgage Company and Allied Group Mortgage Company
Purchase Details
Closed on
Nov 21, 2005
Sold by
Bolin Rosalie Ann
Bought by
Bolin Kevin Eugene
Create a Home Valuation Report for This Property
The Home Valuation Report is an in-depth analysis detailing your home's value as well as a comparison with similar homes in the area
Home Values in the Area
Average Home Value in this Area
Purchase History
| Date | Buyer | Sale Price | Title Company |
|---|---|---|---|
| Mart David L | $209,500 | None Available | |
| Ahsure Investments Llc | -- | None Available | |
| Administrator Of Veterans Affairs | $94,000 | None Available | |
| Nationwide Advantage Mortgage Company | $94,403 | None Available | |
| Bolin Kevin Eugene | -- | None Available |
Source: Public Records
Mortgage History
| Date | Status | Borrower | Loan Amount |
|---|---|---|---|
| Open | Mart David L | $178,125 |
Source: Public Records
Tax History Compared to Growth
Tax History
| Year | Tax Paid | Tax Assessment Tax Assessment Total Assessment is a certain percentage of the fair market value that is determined by local assessors to be the total taxable value of land and additions on the property. | Land | Improvement |
|---|---|---|---|---|
| 2025 | $4,448 | $244,200 | $41,600 | $202,600 |
| 2024 | $4,590 | $243,400 | $41,600 | $201,800 |
| 2023 | $4,590 | $234,700 | $41,600 | $193,100 |
| 2022 | $3,856 | $207,200 | $41,600 | $165,600 |
| 2021 | $3,930 | $177,400 | $41,600 | $135,800 |
| 2020 | $3,930 | $172,600 | $41,600 | $131,000 |
| 2019 | $3,800 | $169,400 | $41,600 | $127,800 |
| 2018 | $3,696 | $169,400 | $41,600 | $127,800 |
| 2017 | $3,696 | $168,400 | $41,600 | $126,800 |
| 2016 | $3,644 | $168,400 | $41,600 | $126,800 |
| 2015 | $3,550 | $165,020 | $41,625 | $123,395 |
| 2014 | $3,550 | $165,020 | $41,625 | $123,395 |
| 2013 | $3,376 | $165,020 | $41,625 | $123,395 |
Source: Public Records
Map
Nearby Homes
- 2641 Union Dr SW
- 5810 Bethpage Cir SW
- Tbd Old River Rd SW
- 1410 Scarlet Sage Dr SW
- 5112 Scenic View Ct SW
- Lot 2
- Lot 6 College Farms 5th Addition SW
- 0 41st Avenue Dr SW Unit 202507355
- 0 41st Avenue Dr SW Unit 1 Ac
- 0 41st Avenue Dr SW Unit 2.25 Ac
- 6614 Scarlet Rose Cir SW
- 3728 Sunshine St SW
- 1719 Prairie Rose Dr SW
- TBD Old River Rd SW
- 6612 Artesa Bell Dr SW
- 6812 Artesa Bell Dr SW
- 7006 Colpepper Dr SW
- 7113 Chenango Ln SW
- 4240 Briar Ridge Ct
- 72 Miller Ave SW Unit 8
- 5115 Ely Rd SW
- 5055 Ely Rd SW
- 5125 Ely Rd SW
- 2600 Union Dr SW
- 5110 Ely Rd SW
- 2557 Worthington Dr SW
- 2537 Worthington Rd
- 5200 Old Ely Rd SW
- 2610 Union Dr SW
- 5200 Ely Rd SW
- 5011 Ely Rd SW
- 5201 Old Ely Rd SW
- 2547 Worthington Dr SW
- 5221 Old Ely Rd SW
- 2601 Worthington Dr SW
- 2607 Worthington Dr SW
- 5040 Ely Rd SW
- 2620 Union Dr SW
- 2527 Worthington Dr SW
- 5220 Ely Rd SW