5101 Fioli Loop Unit 35 San Ramon, CA 94582
Gale Ranch-Windemere NeighborhoodEstimated Value: $1,070,000 - $1,169,000
3
Beds
3
Baths
2,330
Sq Ft
$483/Sq Ft
Est. Value
About This Home
This home is located at 5101 Fioli Loop Unit 35, San Ramon, CA 94582 and is currently estimated at $1,124,326, approximately $482 per square foot. 5101 Fioli Loop Unit 35 is a home located in Contra Costa County with nearby schools including Hidden Hills Elementary School, Windemere Ranch Middle School, and Dougherty Valley High School.
Ownership History
Date
Name
Owned For
Owner Type
Purchase Details
Closed on
Jul 5, 2023
Sold by
Shah Nirav Dilipkumar and Vishwal Nirav
Bought by
Nirav And Vishwal Revocable Trust and Shah
Current Estimated Value
Purchase Details
Closed on
Nov 14, 2013
Sold by
Sweeny Michael J
Bought by
Shah Nirav D and Shah Vishwal N
Home Financials for this Owner
Home Financials are based on the most recent Mortgage that was taken out on this home.
Original Mortgage
$552,000
Interest Rate
3.5%
Mortgage Type
Adjustable Rate Mortgage/ARM
Purchase Details
Closed on
Jul 17, 2013
Sold by
Peterson Joan F
Bought by
Sweeney Michael J
Purchase Details
Closed on
Oct 26, 2009
Sold by
Petri Jeannette
Bought by
Sweeny Michael J
Home Financials for this Owner
Home Financials are based on the most recent Mortgage that was taken out on this home.
Original Mortgage
$497,924
Interest Rate
5%
Mortgage Type
FHA
Create a Home Valuation Report for This Property
The Home Valuation Report is an in-depth analysis detailing your home's value as well as a comparison with similar homes in the area
Home Values in the Area
Average Home Value in this Area
Purchase History
| Date | Buyer | Sale Price | Title Company |
|---|---|---|---|
| Nirav And Vishwal Revocable Trust | -- | None Listed On Document | |
| Shah Nirav D | $690,000 | Chicago Title Company | |
| Sweeney Michael J | -- | None Available | |
| Sweeny Michael J | -- | Commerce Title Company | |
| Peterson Joan F | -- | Commerce Title Company | |
| Sweeny Michael J | $508,000 | Commerce Title Company |
Source: Public Records
Mortgage History
| Date | Status | Borrower | Loan Amount |
|---|---|---|---|
| Previous Owner | Shah Nirav D | $552,000 | |
| Previous Owner | Sweeny Michael J | $497,924 |
Source: Public Records
Tax History
| Year | Tax Paid | Tax Assessment Tax Assessment Total Assessment is a certain percentage of the fair market value that is determined by local assessors to be the total taxable value of land and additions on the property. | Land | Improvement |
|---|---|---|---|---|
| 2025 | $13,178 | $845,836 | $478,082 | $367,754 |
| 2024 | $13,034 | $829,252 | $468,708 | $360,544 |
| 2023 | $13,034 | $812,993 | $459,518 | $353,475 |
| 2022 | $12,832 | $797,053 | $450,508 | $346,545 |
| 2021 | $12,536 | $781,425 | $441,675 | $339,750 |
| 2019 | $12,354 | $758,250 | $428,576 | $329,674 |
| 2018 | $11,967 | $743,383 | $420,173 | $323,210 |
| 2017 | $11,790 | $728,808 | $411,935 | $316,873 |
| 2016 | $11,693 | $714,518 | $403,858 | $310,660 |
| 2015 | $11,534 | $703,786 | $397,792 | $305,994 |
| 2014 | $11,424 | $690,000 | $390,000 | $300,000 |
Source: Public Records
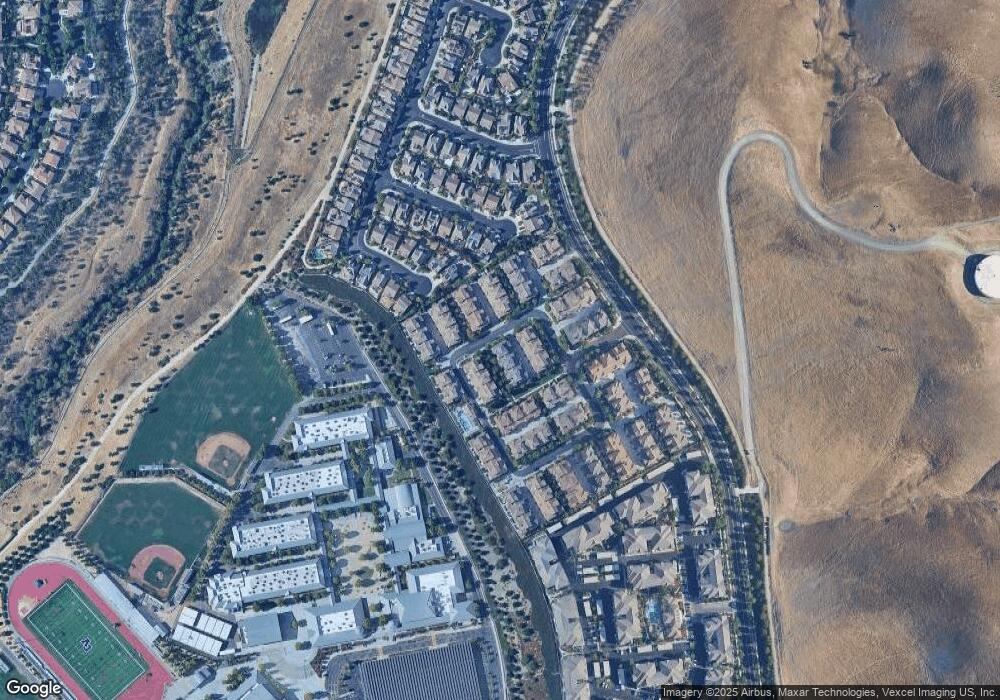
Map
Nearby Homes
- 257 Wimbledon Ct
- 217 Wimbledon Ct
- 5216 Fioli Loop Unit 76
- 5300 Fioli Loop
- 2650 Casella Way
- 3252 Carpenter Way
- 2359 Magnolia Bridge Dr
- 2464 Millstream Ln Unit 146
- 1615 Lawrence Rd
- 6260 Main Branch Rd
- 112 Begonia Ct
- 1610 Lawrence Rd
- 116 Macedon Ct
- 2352 Millstream Ln
- 626 Karina Ct
- 6132 Alpine Blue Dr
- 5162 Rowan Dr
- 3138 Ashbrook Ln
- 5130 Rowan Dr
- 3132 Ashbrook Ln
- 5103 Fioli Loop
- 5105 Fioli Loop Unit 37
- 5107 Fioli Loop
- 5021 Fioli Loop Unit 46
- 5109 Fioli Loop Unit 39
- 5017 Fioli Loop Unit 45
- 5117 Fioli Loop
- 5115 Fioli Loop Unit 10
- 5013 Fioli Loop Unit 44
- 5119 Fioli Loop Unit 8
- 5100 Fioli Loop Unit 23
- 5111 Fioli Loop Unit 40
- 5009 Fioli Loop Unit 43
- 5121 Fioli Loop
- 5086 Fioli Loop
- 5123 Fioli Loop
- 5005 Fioli Loop Unit 42
- 5102 Fioli Loop
- 5001 Fioli Loop
- 5116 Fioli Loop Unit 22
Your Personal Tour Guide
Ask me questions while you tour the home.