Estimated Value: $175,000 - $194,000
3
Beds
2
Baths
1,300
Sq Ft
$142/Sq Ft
Est. Value
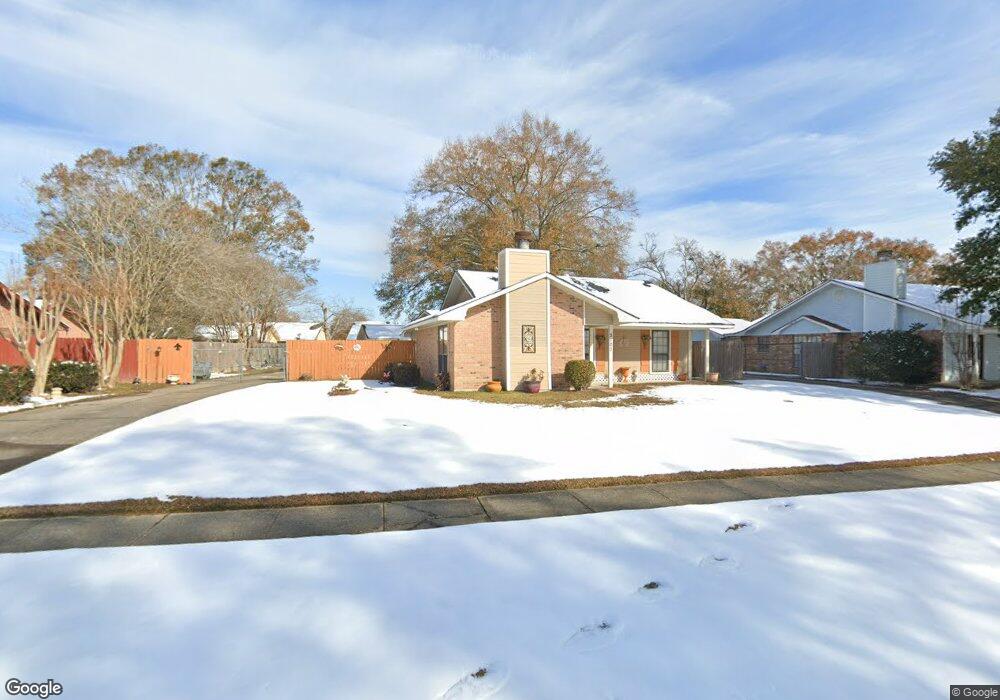
About This Home
This home is located at 5103 W Shilo Ave, Baker, LA 70714 and is currently estimated at $184,213, approximately $141 per square foot. 5103 W Shilo Ave is a home located in East Baton Rouge Parish with nearby schools including Baker Heights Elementary School, Baker Middle School, and Baker High School.
Ownership History
Date
Name
Owned For
Owner Type
Purchase Details
Closed on
Oct 5, 2020
Sold by
Selders Urlecia D Jackson
Bought by
Alexander Clay and Alexander Frankie Ann
Current Estimated Value
Home Financials for this Owner
Home Financials are based on the most recent Mortgage that was taken out on this home.
Original Mortgage
$151,515
Outstanding Balance
$134,765
Interest Rate
2.9%
Mortgage Type
New Conventional
Estimated Equity
$49,448
Purchase Details
Closed on
Dec 27, 2012
Sold by
Duperrier Josue
Bought by
Jackson Urlecia D
Home Financials for this Owner
Home Financials are based on the most recent Mortgage that was taken out on this home.
Original Mortgage
$117,727
Interest Rate
3.75%
Mortgage Type
FHA
Purchase Details
Closed on
Aug 6, 2010
Sold by
Wells Fargo Bank
Bought by
Duperrier Josue
Create a Home Valuation Report for This Property
The Home Valuation Report is an in-depth analysis detailing your home's value as well as a comparison with similar homes in the area
Home Values in the Area
Average Home Value in this Area
Purchase History
| Date | Buyer | Sale Price | Title Company |
|---|---|---|---|
| Alexander Clay | $150,000 | Titleplus Llc | |
| Jackson Urlecia D | $119,900 | -- | |
| Duperrier Josue | $69,200 | -- |
Source: Public Records
Mortgage History
| Date | Status | Borrower | Loan Amount |
|---|---|---|---|
| Open | Alexander Clay | $151,515 | |
| Previous Owner | Jackson Urlecia D | $117,727 |
Source: Public Records
Tax History
| Year | Tax Paid | Tax Assessment Tax Assessment Total Assessment is a certain percentage of the fair market value that is determined by local assessors to be the total taxable value of land and additions on the property. | Land | Improvement |
|---|---|---|---|---|
| 2024 | $780 | $14,250 | $1,600 | $12,650 |
| 2023 | $753 | $14,250 | $1,600 | $12,650 |
| 2022 | $1,600 | $14,250 | $1,600 | $12,650 |
| 2021 | $1,586 | $14,250 | $1,600 | $12,650 |
| 2020 | $1,269 | $11,250 | $1,600 | $9,650 |
| 2019 | $1,312 | $11,250 | $1,600 | $9,650 |
| 2018 | $1,295 | $11,250 | $1,600 | $9,650 |
| 2017 | $1,295 | $11,250 | $1,600 | $9,650 |
| 2016 | $88 | $7,873 | $1,600 | $6,273 |
| 2015 | $433 | $10,950 | $1,600 | $9,350 |
| 2014 | $432 | $10,950 | $1,600 | $9,350 |
| 2013 | -- | $10,950 | $1,600 | $9,350 |
Source: Public Records
Map
Nearby Homes
- 5203 Circle Dr
- 5601 E Tigre Chenes Ct
- 5125 Weston St
- 5137 Weston St
- 1006 Shilo Ave
- 1011 Sherron Ave
- 999 No Street Name Other
- 5245 Groom Rd
- Lot E Hazeloak Dr
- Lot C Hazeloak Dr
- 1306 Hazeloak Dr
- 4406 Fourchon Dr
- 801 Chipley St
- 1271 Doctor Mlk Junior Ln
- 4502 Fausse Dr
- 5885 Lavey Ln Unit 128
- 5885 Lavey Ln Unit 125
- 5885 Lavey Ln Unit 131
- 5885 Lavey Ln Unit 123
- 5885 Lavey Ln Unit 26
- 5103 W Shilo Dr
- 5105 W Shilo Ave
- 5101 W Shilo Ave
- 1015 W Shilo Dr
- 5104 Harding St
- 5107 W Shilo Ave
- 5106 Harding St Unit 1
- 5102 W Shilo Ave
- 5104 W Shilo Ave
- 5108 W Shilo Ave
- 801 Sandra Dr
- 1140 W Shilo Dr Unit B
- 1140 W Shilo Dr Unit D
- 1140 W Shilo Dr Unit C
- 1140 W Shilo Dr
- 1120 W Shilo Dr Unit A
- 1120 W Shilo Dr Unit B
- 1120 W Shilo Dr Unit D
- 1120 W Shilo Dr
- 1110 W Shilo Dr Unit D
Your Personal Tour Guide
Ask me questions while you tour the home.