5105 Crawford Rd Gastonia, NC 28052
Estimated Value: $99,000 - $213,000
2
Beds
1
Bath
960
Sq Ft
$155/Sq Ft
Est. Value
About This Home
This home is located at 5105 Crawford Rd, Gastonia, NC 28052 and is currently estimated at $148,538, approximately $154 per square foot. 5105 Crawford Rd is a home located in Gaston County with nearby schools including Southwest Middle School, Hunter Huss High School, and Victory Christian Academy.
Ownership History
Date
Name
Owned For
Owner Type
Purchase Details
Closed on
Oct 29, 2012
Sold by
Mcpeters William Ray and Mcpeters Jamie Beaver
Bought by
Woodward James E and Woodward Betty R
Current Estimated Value
Purchase Details
Closed on
Jan 16, 2008
Sold by
Davis Larry W and Davis Nora L
Bought by
Mcpeters William R and Mcpeters Jamie B
Home Financials for this Owner
Home Financials are based on the most recent Mortgage that was taken out on this home.
Original Mortgage
$45,000
Interest Rate
6.12%
Mortgage Type
Purchase Money Mortgage
Purchase Details
Closed on
Dec 30, 2005
Sold by
Davis Harry L and Davis Anita
Bought by
Isom Randall K
Home Financials for this Owner
Home Financials are based on the most recent Mortgage that was taken out on this home.
Original Mortgage
$137,500
Interest Rate
6.28%
Mortgage Type
Fannie Mae Freddie Mac
Create a Home Valuation Report for This Property
The Home Valuation Report is an in-depth analysis detailing your home's value as well as a comparison with similar homes in the area
Home Values in the Area
Average Home Value in this Area
Purchase History
| Date | Buyer | Sale Price | Title Company |
|---|---|---|---|
| Woodward James E | $42,000 | None Available | |
| Mcpeters William R | $48,000 | Chicago Title Insurance Co | |
| Isom Randall K | $19,000 | -- |
Source: Public Records
Mortgage History
| Date | Status | Borrower | Loan Amount |
|---|---|---|---|
| Previous Owner | Mcpeters William R | $45,000 | |
| Previous Owner | Isom Randall K | $137,500 |
Source: Public Records
Tax History Compared to Growth
Tax History
| Year | Tax Paid | Tax Assessment Tax Assessment Total Assessment is a certain percentage of the fair market value that is determined by local assessors to be the total taxable value of land and additions on the property. | Land | Improvement |
|---|---|---|---|---|
| 2025 | $224 | $62,830 | $13,310 | $49,520 |
| 2024 | $224 | $62,830 | $13,310 | $49,520 |
| 2023 | $218 | $62,830 | $13,310 | $49,520 |
| 2022 | $341 | $37,060 | $9,510 | $27,550 |
| 2021 | $342 | $37,060 | $9,510 | $27,550 |
| 2019 | $346 | $37,060 | $9,510 | $27,550 |
| 2018 | $513 | $52,640 | $10,867 | $41,773 |
| 2017 | $513 | $52,640 | $10,867 | $41,773 |
| 2016 | $513 | $52,640 | $0 | $0 |
| 2014 | $410 | $42,523 | $12,675 | $29,848 |
Source: Public Records
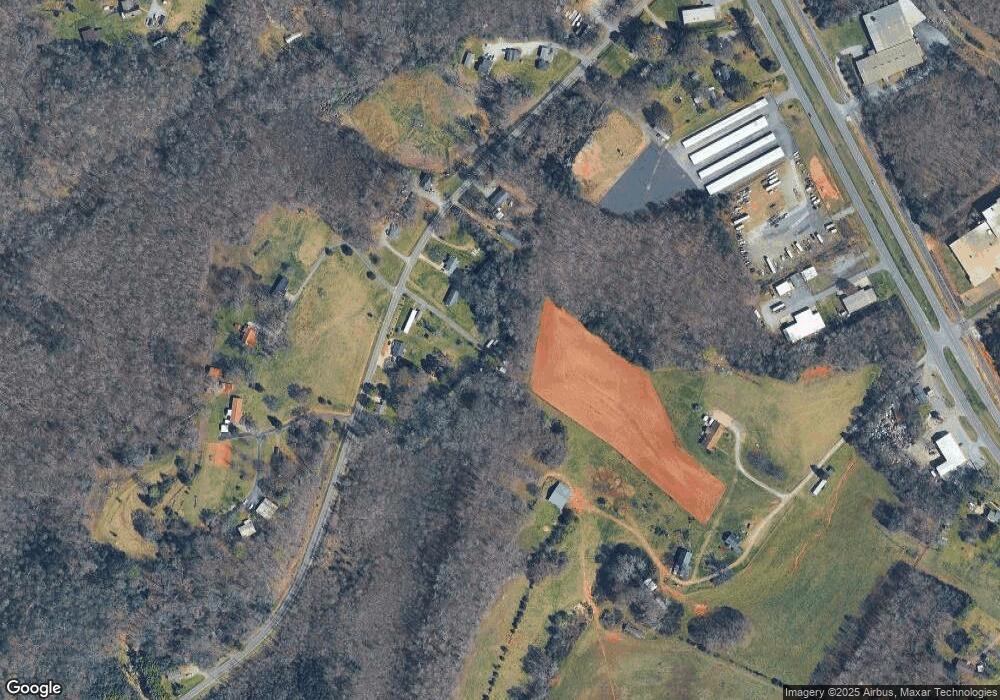
Map
Nearby Homes
- 0 York Hwy
- TBD York Hwy
- 3054 Sassafras Trail
- 3052 Sassafras Trail
- Penwell Plan at Brandon Creek
- Robie Plan at Brandon Creek
- HANOVER Plan at Brandon Creek
- Cali Plan at Brandon Creek
- Wilmington Plan at Brandon Creek
- Winston Plan at Brandon Creek
- Hayden Plan at Brandon Creek
- Aria Plan at Brandon Creek
- 3050 Sassafras Trail
- 3046 Sassafras Trail
- 3045 Sassafras Trail
- 3040 Sassafras Trail
- 924 Ferguson Ridge Rd
- 0000 Woodcrest Dr
- 145 Mccarver Rd
- 226 Lingerfelt Dr
- 5101 Crawford Rd
- 5051 Crawford Rd
- 5109 Crawford Rd
- 5055 Crawford Rd
- 5047 Crawford Rd
- 5113 Crawford Rd
- 5043 Crawford Rd
- 5046 Crawford Rd
- 5052 York Hwy
- 5110 Crawford Rd
- 5024 Crawford Rd
- 5130 Crawford Rd
- 5054 York Hwy
- 5019 Crawford Rd
- 5016 York Hwy
- 5013 Crawford Rd
- 5012 York Hwy
- 175 Old Depot Rd
- 5146 Crawford Rd
- 839 Crawford Rd