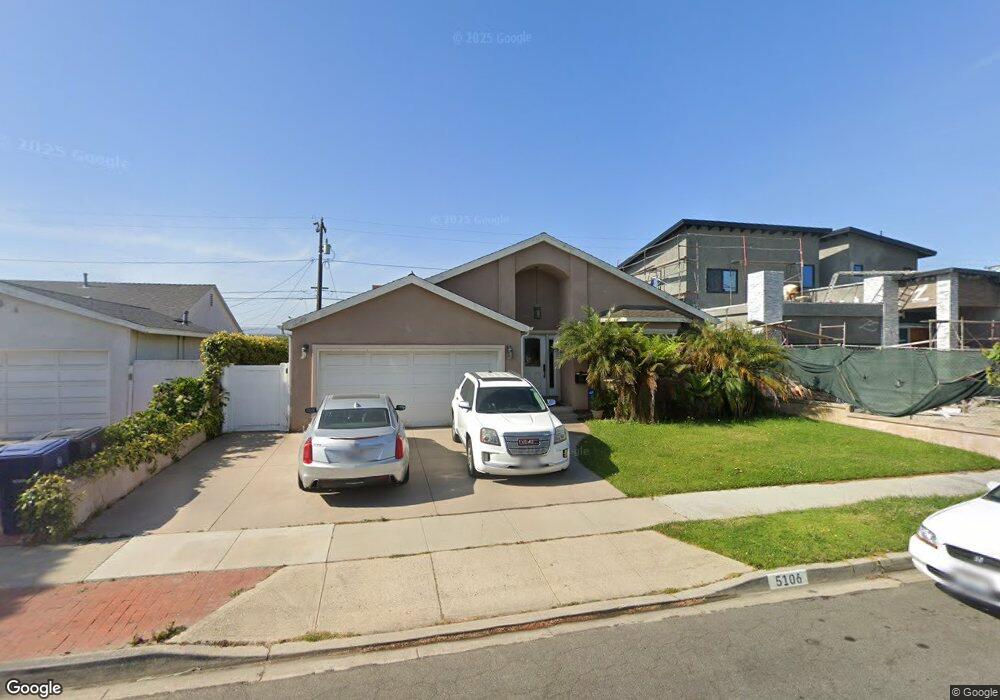
5106 Ruby St Torrance, CA 90503
Southwood NeighborhoodEstimated Value: $1,407,869 - $1,601,000
3
Beds
2
Baths
1,777
Sq Ft
$848/Sq Ft
Est. Value
About This Home
This home is located at 5106 Ruby St, Torrance, CA 90503 and is currently estimated at $1,506,217, approximately $847 per square foot. 5106 Ruby St is a home located in Los Angeles County with nearby schools including Anza Elementary School, Jefferson Middle School, and West High School.
Ownership History
Date
Name
Owned For
Owner Type
Purchase Details
Closed on
Nov 1, 2006
Sold by
Ullfig Daniel and Ullfig Martha
Bought by
Ullfig Daniel
Current Estimated Value
Purchase Details
Closed on
May 21, 2005
Sold by
Thompson Jacqueline and Thompson Glenn
Bought by
Thompson Glenn Robert
Purchase Details
Closed on
Jun 4, 2003
Sold by
Thompson Jacqueline
Bought by
Thompson Jacqueline
Create a Home Valuation Report for This Property
The Home Valuation Report is an in-depth analysis detailing your home's value as well as a comparison with similar homes in the area
Home Values in the Area
Average Home Value in this Area
Purchase History
| Date | Buyer | Sale Price | Title Company |
|---|---|---|---|
| Ullfig Daniel | -- | None Available | |
| Ullfig Daniel | -- | None Available | |
| Thompson Glenn Robert | -- | -- | |
| Thompson Jacqueline | -- | -- |
Source: Public Records
Tax History
| Year | Tax Paid | Tax Assessment Tax Assessment Total Assessment is a certain percentage of the fair market value that is determined by local assessors to be the total taxable value of land and additions on the property. | Land | Improvement |
|---|---|---|---|---|
| 2025 | $7,420 | $647,948 | $398,861 | $249,087 |
| 2024 | $7,420 | $635,244 | $391,041 | $244,203 |
| 2023 | $7,284 | $622,789 | $383,374 | $239,415 |
| 2022 | $7,186 | $610,578 | $375,857 | $234,721 |
| 2021 | $7,052 | $598,607 | $368,488 | $230,119 |
| 2019 | $6,847 | $580,854 | $357,559 | $223,295 |
| 2018 | $6,611 | $569,466 | $350,549 | $218,917 |
| 2016 | $6,310 | $547,355 | $336,938 | $210,417 |
| 2015 | $6,172 | $539,134 | $331,877 | $207,257 |
| 2014 | $6,012 | $528,574 | $325,376 | $203,198 |
Source: Public Records
Map
Nearby Homes
- 5033 Carmen St
- 21110 Wood Ave
- 4926 Jacques St
- 5117 Cathann St
- 1200 Opal St Unit 7
- 21221 Grant Ave
- 5316 Emerald St
- 1108 Camino Real Unit 407
- 1108 Camino Real Unit 406
- 1108 Camino Real Unit 306
- 1108 Camino Real Unit 409
- 603 S Prospect Ave Unit 205
- 601 S Prospect Ave Unit 103
- 1100 Barbara St
- 1110 Barbara St
- 902 Camino Real Unit 207
- 802 Camino Real Unit 206
- 21345 Hawthorne Blvd Unit 114
- 308 S Lucia Ave
- 5427 Edgemere Dr
Your Personal Tour Guide
Ask me questions while you tour the home.