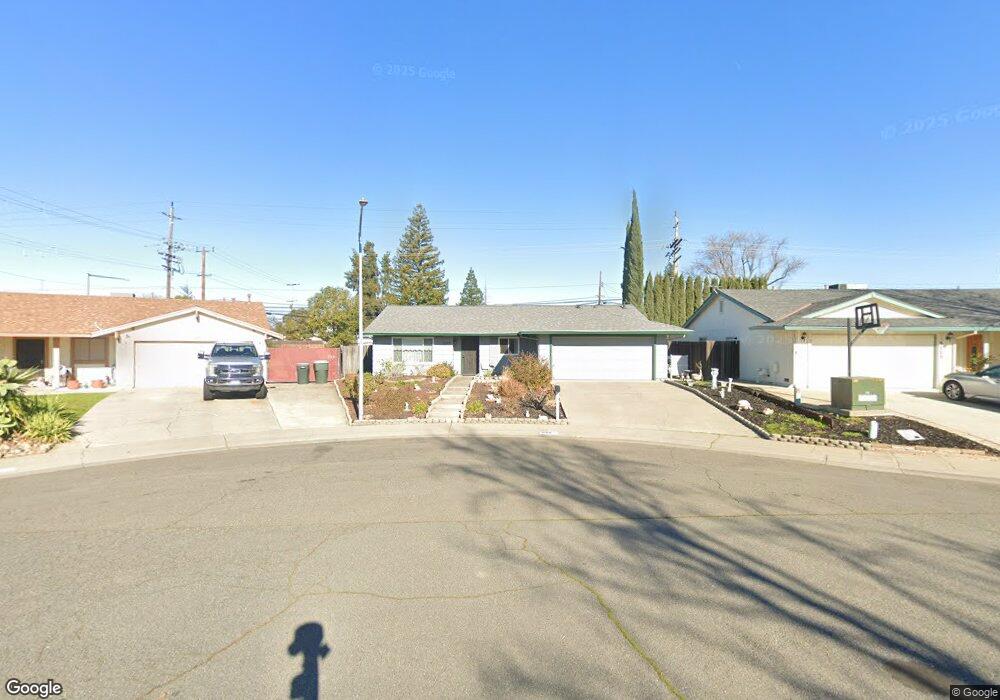
5109 Appleton Ct Carmichael, CA 95608
Oakvale NeighborhoodEstimated Value: $467,306 - $559,000
4
Beds
2
Baths
1,623
Sq Ft
$323/Sq Ft
Est. Value
About This Home
This home is located at 5109 Appleton Ct, Carmichael, CA 95608 and is currently estimated at $524,827, approximately $323 per square foot. 5109 Appleton Ct is a home located in Sacramento County with nearby schools including Pasadena Avenue Elementary School, Winston Churchill Middle School, and Mira Loma High School.
Ownership History
Date
Name
Owned For
Owner Type
Purchase Details
Closed on
Feb 3, 2017
Sold by
Bouressa Cheryl Lynn
Bought by
Bouressa Cheryl Lynn and Cheryl Lynn Bouressa Revocable
Current Estimated Value
Purchase Details
Closed on
Jul 25, 2012
Sold by
Bouressa Cheryl Lynn
Bought by
Bouressa Cheryl Lynn
Home Financials for this Owner
Home Financials are based on the most recent Mortgage that was taken out on this home.
Original Mortgage
$208,750
Outstanding Balance
$144,476
Interest Rate
3.65%
Mortgage Type
New Conventional
Estimated Equity
$380,351
Purchase Details
Closed on
Jun 27, 2007
Sold by
Bouressa Cheryl Lynn
Bought by
Bouressa Cheryl Lynn
Purchase Details
Closed on
Aug 17, 2006
Sold by
Bell Bruce S and Bouressa Cheryl Lynn
Bought by
Bouressa Cheryl Lynn
Home Financials for this Owner
Home Financials are based on the most recent Mortgage that was taken out on this home.
Original Mortgage
$209,000
Interest Rate
6.76%
Mortgage Type
New Conventional
Purchase Details
Closed on
Jan 11, 1996
Sold by
Wiley Daril L and Wiley Sandra J
Bought by
Bell Bruce S and Bouressa Cheryl Lynn
Home Financials for this Owner
Home Financials are based on the most recent Mortgage that was taken out on this home.
Original Mortgage
$129,000
Interest Rate
7.18%
Create a Home Valuation Report for This Property
The Home Valuation Report is an in-depth analysis detailing your home's value as well as a comparison with similar homes in the area
Home Values in the Area
Average Home Value in this Area
Purchase History
| Date | Buyer | Sale Price | Title Company |
|---|---|---|---|
| Bouressa Cheryl Lynn | -- | None Available | |
| Bouressa Cheryl Lynn | -- | None Available | |
| Bouressa Cheryl Lynn | -- | None Available | |
| Bouressa Cheryl Lynn | -- | Alliance Title Company | |
| Bell Bruce S | $133,000 | North American Title Co |
Source: Public Records
Mortgage History
| Date | Status | Borrower | Loan Amount |
|---|---|---|---|
| Open | Bouressa Cheryl Lynn | $208,750 | |
| Closed | Bouressa Cheryl Lynn | $209,000 | |
| Closed | Bell Bruce S | $129,000 |
Source: Public Records
Tax History
| Year | Tax Paid | Tax Assessment Tax Assessment Total Assessment is a certain percentage of the fair market value that is determined by local assessors to be the total taxable value of land and additions on the property. | Land | Improvement |
|---|---|---|---|---|
| 2025 | $2,555 | $220,919 | $74,743 | $146,176 |
| 2024 | $2,555 | $216,588 | $73,278 | $143,310 |
| 2023 | $2,513 | $212,342 | $71,842 | $140,500 |
| 2022 | $2,462 | $208,180 | $70,434 | $137,746 |
| 2021 | $2,420 | $204,099 | $69,053 | $135,046 |
| 2020 | $2,374 | $202,007 | $68,345 | $133,662 |
| 2019 | $2,325 | $198,047 | $67,005 | $131,042 |
| 2018 | $2,297 | $194,165 | $65,692 | $128,473 |
| 2017 | $2,273 | $190,358 | $64,404 | $125,954 |
| 2016 | $2,123 | $186,627 | $63,142 | $123,485 |
| 2015 | $2,131 | $183,825 | $62,194 | $121,631 |
| 2014 | $2,086 | $180,225 | $60,976 | $119,249 |
Source: Public Records
Map
Nearby Homes
- 5307 Nyoda Way
- 5213 Gibbons Dr
- 3430 Nadine St
- 5151 Janell Way
- 3431 Hunter Ln
- 3923 Oak Villa Cir
- 4007 Oak Villa Cir
- 4016 Knoll Top Ct
- 4719 Eli Ct
- 3332 Jayanne Way
- 4941 Wendy Ct
- 5500 Whitfield Way
- 4740 Whitney Ave
- 5004 Cypress Ave
- 3312 Jayanne Way
- 5113 Walnut Garden Ct
- 3219 Smathers Way
- 5443 Aris Way
- 3213 Smathers Way
- 4141 Walnut Ave
- 5113 Appleton Ct
- 5105 Appleton Ct
- 5100 Appleton Ct
- 5127 Engle Rd
- 3642 Affirmed Way
- 5123 Engle Rd
- 5112 Appleton Ct
- 3638 Affirmed Way
- 5108 Appleton Ct
- 5131 Engle Rd
- 5104 Appleton Ct
- 3634 Affirmed Way
- 3708 Walnut Ave
- 3630 Affirmed Way
- 5140 Engle Rd
- 3632 Duca Ln
- 3627 Affirmed Way
- 5042 Engle Rd
- 5122 Walnut Pointe Ln
- 3626 Affirmed Way
Your Personal Tour Guide
Ask me questions while you tour the home.