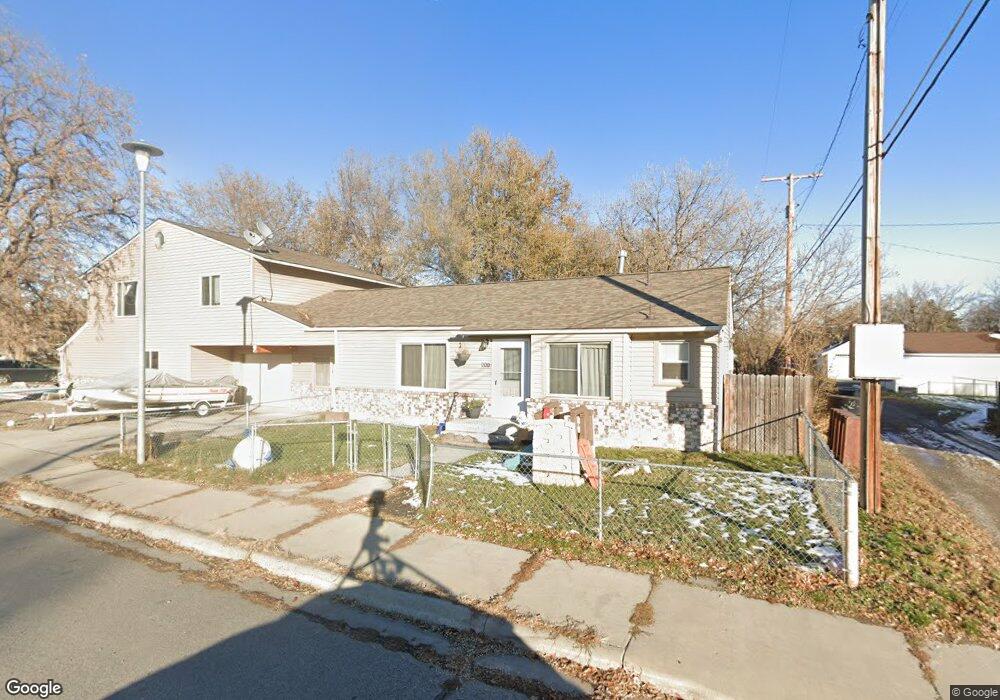
511 11th St W Billings, MT 59102
East Central Billings NeighborhoodEstimated Value: $233,000 - $260,552
3
Beds
2
Baths
1,381
Sq Ft
$178/Sq Ft
Est. Value
About This Home
This home is located at 511 11th St W, Billings, MT 59102 and is currently estimated at $246,138, approximately $178 per square foot. 511 11th St W is a home located in Yellowstone County with nearby schools including Washington School, Lewis & Clark Junior High School, and Billings Senior High School.
Ownership History
Date
Name
Owned For
Owner Type
Purchase Details
Closed on
Nov 7, 2018
Sold by
Jones John D and Jones Anna L
Bought by
Brunk Katie
Current Estimated Value
Home Financials for this Owner
Home Financials are based on the most recent Mortgage that was taken out on this home.
Original Mortgage
$6,543
Outstanding Balance
$5,765
Interest Rate
4.9%
Mortgage Type
Unknown
Estimated Equity
$240,373
Purchase Details
Closed on
Dec 7, 2015
Sold by
Dinardi Brent
Bought by
Webster Clifford S and Webster Tonya L
Home Financials for this Owner
Home Financials are based on the most recent Mortgage that was taken out on this home.
Original Mortgage
$166,822
Interest Rate
3.93%
Purchase Details
Closed on
Aug 21, 2009
Sold by
Zinvest Llp
Bought by
Jones John D and Jones Anna Lee
Home Financials for this Owner
Home Financials are based on the most recent Mortgage that was taken out on this home.
Original Mortgage
$123,649
Interest Rate
5.09%
Mortgage Type
FHA
Purchase Details
Closed on
Jan 26, 2009
Sold by
Zimmerer Steve L
Bought by
Zinvest Llp
Purchase Details
Closed on
Dec 26, 2008
Sold by
The Bank Of New York Mellon
Bought by
Zimmerer Steve L
Purchase Details
Closed on
Mar 4, 2008
Sold by
Fowler Pauline F
Bought by
Bank Of New York
Create a Home Valuation Report for This Property
The Home Valuation Report is an in-depth analysis detailing your home's value as well as a comparison with similar homes in the area
Home Values in the Area
Average Home Value in this Area
Purchase History
| Date | Buyer | Sale Price | Title Company |
|---|---|---|---|
| Brunk Katie | -- | -- | |
| Webster Clifford S | $196,300 | -- | |
| Jones John D | -- | None Available | |
| Zinvest Llp | -- | None Available | |
| Zimmerer Steve L | -- | None Available | |
| Bank Of New York | -- | None Available |
Source: Public Records
Mortgage History
| Date | Status | Borrower | Loan Amount |
|---|---|---|---|
| Open | Brunk Katie | $6,543 | |
| Open | Brunk Katie | $130,853 | |
| Previous Owner | Webster Clifford S | $166,822 | |
| Previous Owner | Webster Clifford S | -- | |
| Previous Owner | Jones John D | $123,649 |
Source: Public Records
Tax History Compared to Growth
Tax History
| Year | Tax Paid | Tax Assessment Tax Assessment Total Assessment is a certain percentage of the fair market value that is determined by local assessors to be the total taxable value of land and additions on the property. | Land | Improvement |
|---|---|---|---|---|
| 2025 | $1,854 | $199,900 | $16,358 | $183,542 |
| 2024 | $1,854 | $191,800 | $15,813 | $175,987 |
| 2023 | $1,844 | $191,800 | $15,813 | $175,987 |
| 2022 | $1,565 | $141,600 | $16,053 | $125,547 |
| 2021 | $1,490 | $141,600 | $0 | $0 |
| 2020 | $1,363 | $121,100 | $0 | $0 |
| 2019 | $1,298 | $121,100 | $0 | $0 |
| 2018 | $1,201 | $109,300 | $0 | $0 |
| 2017 | $1,166 | $109,300 | $0 | $0 |
| 2016 | $1,137 | $107,224 | $0 | $0 |
| 2015 | $1,171 | $111,064 | $0 | $0 |
| 2014 | $1,158 | $58,578 | $0 | $0 |
Source: Public Records
Map
Nearby Homes
- 1019 Miles Ave
- 927 Miles Ave
- 925 Miles Ave
- 1122 Howard Ave
- 112 11th St W
- 1256 & 1260 Yellowstone Ave
- 1214 Clark Ave
- 1263 Yellowstone Ave
- 1265 Yellowstone Ave
- 1310 Yellowstone Ave Unit 6
- 1310 Yellowstone Ave Unit 11
- 1310 Yellowstone Ave Unit 16
- 1230 Clark Ave
- 812 Miles Ave
- 1113 Lynn Ave
- 1225 Clark Ave
- 1231 Saint Johns Ave
- 1107 12th St W
- 1346 Broadwater Ave
- 805 Clark Ave
- 1042 Custer Ave
- 1040 Custer Ave
- 1043 Terry Ave
- 1041 Terry Ave
- 1038 Custer Ave
- 1035 Terry Ave
- 1108 Custer Ave
- 1034 Custer Ave
- 1105 Terry Ave
- 1030 Custer Ave
- 1027 Terry Ave
- 1026 Custer Ave
- 1112 Custer Ave
- 1111 Terry Ave
- 1025 Terry Ave
- 1043 Custer Ave
- 1039 Custer Ave
- 1024 Custer Ave
- 610 11th St W
- 610 11th St W