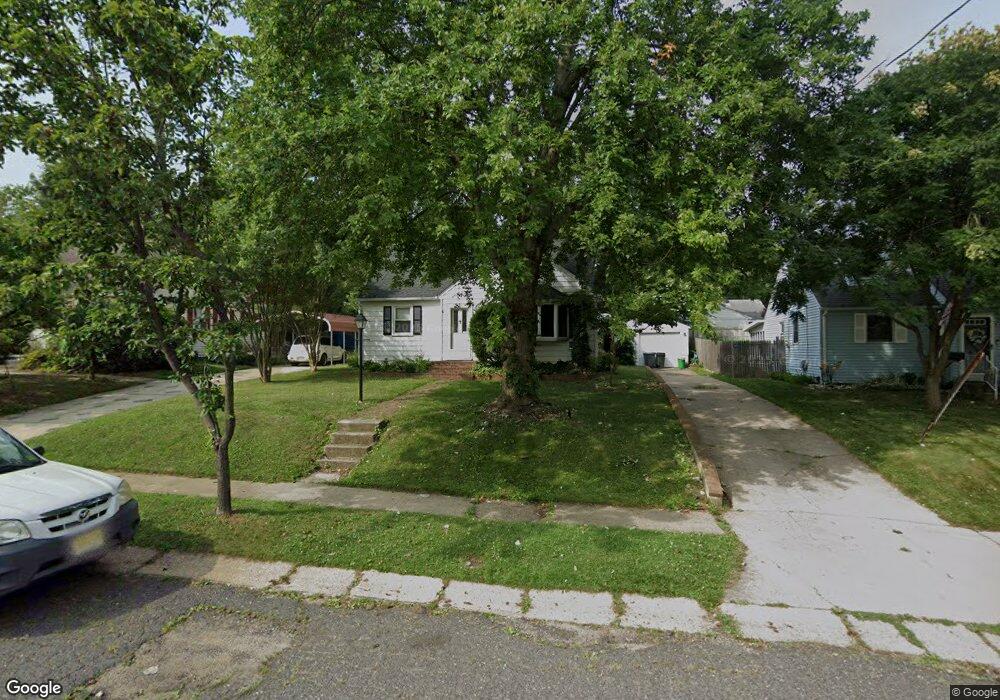
511 Charles Ave Barrington, NJ 08007
Estimated Value: $343,919 - $430,000
--
Bed
--
Bath
1,668
Sq Ft
$223/Sq Ft
Est. Value
About This Home
This home is located at 511 Charles Ave, Barrington, NJ 08007 and is currently estimated at $372,730, approximately $223 per square foot. 511 Charles Ave is a home located in Camden County with nearby schools including Avon Elementary School, Woodland Elementary School, and Saint Rose of Lima Catholic School.
Ownership History
Date
Name
Owned For
Owner Type
Purchase Details
Closed on
Apr 27, 2023
Sold by
Rybeck Debra
Bought by
Rybeck Debra and Barruzza Michael
Current Estimated Value
Home Financials for this Owner
Home Financials are based on the most recent Mortgage that was taken out on this home.
Original Mortgage
$164,400
Interest Rate
6.39%
Mortgage Type
New Conventional
Purchase Details
Closed on
May 25, 2006
Sold by
Norkis Jan
Bought by
Rybeck Debra
Home Financials for this Owner
Home Financials are based on the most recent Mortgage that was taken out on this home.
Original Mortgage
$118,000
Interest Rate
6.67%
Purchase Details
Closed on
Aug 4, 2003
Sold by
Gallagher David M
Bought by
Norkis Jan M and Norkis Lora E
Home Financials for this Owner
Home Financials are based on the most recent Mortgage that was taken out on this home.
Original Mortgage
$130,400
Interest Rate
5.69%
Create a Home Valuation Report for This Property
The Home Valuation Report is an in-depth analysis detailing your home's value as well as a comparison with similar homes in the area
Home Values in the Area
Average Home Value in this Area
Purchase History
| Date | Buyer | Sale Price | Title Company |
|---|---|---|---|
| Rybeck Debra | -- | Hunter Title | |
| Rybeck Debra | -- | Hunter Title | |
| Rybeck Debra | $209,000 | -- | |
| Norkis Jan M | $144,900 | -- |
Source: Public Records
Mortgage History
| Date | Status | Borrower | Loan Amount |
|---|---|---|---|
| Previous Owner | Rybeck Debra | $164,400 | |
| Previous Owner | Rybeck Debra | $118,000 | |
| Previous Owner | Norkis Jan M | $130,400 |
Source: Public Records
Tax History Compared to Growth
Tax History
| Year | Tax Paid | Tax Assessment Tax Assessment Total Assessment is a certain percentage of the fair market value that is determined by local assessors to be the total taxable value of land and additions on the property. | Land | Improvement |
|---|---|---|---|---|
| 2025 | $8,192 | $171,100 | $54,800 | $116,300 |
| 2024 | $7,910 | $171,100 | $54,800 | $116,300 |
| 2023 | $7,910 | $171,100 | $54,800 | $116,300 |
| 2022 | $7,741 | $171,100 | $54,800 | $116,300 |
| 2021 | $7,108 | $171,100 | $54,800 | $116,300 |
| 2020 | $7,528 | $171,100 | $54,800 | $116,300 |
| 2019 | $7,496 | $171,100 | $54,800 | $116,300 |
| 2018 | $7,350 | $171,100 | $54,800 | $116,300 |
| 2017 | $7,167 | $171,100 | $54,800 | $116,300 |
| 2016 | $7,393 | $197,100 | $82,600 | $114,500 |
| 2015 | $7,151 | $197,100 | $82,600 | $114,500 |
| 2014 | $6,849 | $197,100 | $82,600 | $114,500 |
Source: Public Records
Map
Nearby Homes
- 528 Dubois Ave
- 447 2nd Ave
- 405 Austin Ave
- 133 W Gloucester Pike
- 325 Albany Ave
- 302 Austin Ave
- 309 Oakland Ave
- 29 E Gloucester Pike
- 33 E Gloucester Pike
- 1517 Oak Ave
- 1601 Oak Ave
- 5 Trinity Place
- 94 E Browning Rd
- 425 White Horse Pike
- 127 7th Ave
- 27 Beaver Dr
- 1165 Fulling Mill Ln
- 1720 Prospect Ridge Blvd
- 26 Wilson Ave
- 303 Highland Ave
- 513 Charles Ave
- 509 Charles Ave
- 515 Charles Ave
- 514 Dubois Ave
- 516 Dubois Ave
- 507 Charles Ave
- 512 Dubois Ave
- 518 Dubois Ave
- 508 Charles Ave
- 517 Charles Ave
- 510 Dubois Ave
- 506 Charles Ave
- 510 Charles Ave
- 505 Charles Ave
- 504 Charles Ave
- 520 Dubois Ave
- 512 Charles Ave
- 508 Dubois Ave
- 519 Charles Ave
- 502 Charles Ave