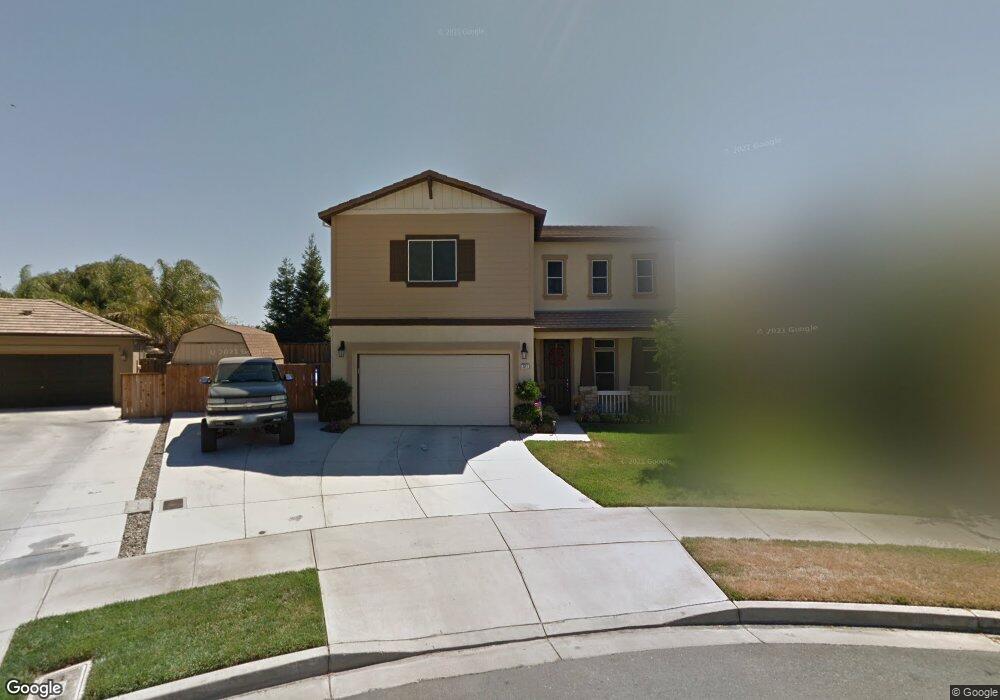
511 Clydesdale Ct Oakdale, CA 95361
Estimated Value: $550,000 - $623,000
3
Beds
3
Baths
2,153
Sq Ft
$269/Sq Ft
Est. Value
About This Home
This home is located at 511 Clydesdale Ct, Oakdale, CA 95361 and is currently estimated at $579,589, approximately $269 per square foot. 511 Clydesdale Ct is a home with nearby schools including Fair Oaks Elementary School, Oakdale Junior High School, and East Stanislaus High School.
Ownership History
Date
Name
Owned For
Owner Type
Purchase Details
Closed on
Jul 20, 2017
Sold by
Gonzales Kevin
Bought by
Gonzales Kevin and Gonzales Heather D
Current Estimated Value
Home Financials for this Owner
Home Financials are based on the most recent Mortgage that was taken out on this home.
Original Mortgage
$230,000
Outstanding Balance
$191,196
Interest Rate
3.91%
Mortgage Type
New Conventional
Estimated Equity
$388,393
Purchase Details
Closed on
Nov 9, 2012
Sold by
Hernandez Heather
Bought by
Gonzales Kevin
Home Financials for this Owner
Home Financials are based on the most recent Mortgage that was taken out on this home.
Original Mortgage
$249,912
Interest Rate
3.37%
Mortgage Type
FHA
Purchase Details
Closed on
Jul 14, 2006
Sold by
Hearthstone Multiasset Entity A Lp
Bought by
Wl Homes Llc
Home Financials for this Owner
Home Financials are based on the most recent Mortgage that was taken out on this home.
Original Mortgage
$250,000
Interest Rate
6.57%
Mortgage Type
Construction
Create a Home Valuation Report for This Property
The Home Valuation Report is an in-depth analysis detailing your home's value as well as a comparison with similar homes in the area
Home Values in the Area
Average Home Value in this Area
Purchase History
| Date | Buyer | Sale Price | Title Company |
|---|---|---|---|
| Gonzales Kevin | -- | Fidelity National Title Co | |
| Gonzales Kevin | -- | Placer Title Company | |
| Gonzales Kevin | $255,000 | Placer Title Company | |
| Wl Homes Llc | -- | Chicago Title |
Source: Public Records
Mortgage History
| Date | Status | Borrower | Loan Amount |
|---|---|---|---|
| Open | Gonzales Kevin | $230,000 | |
| Closed | Gonzales Kevin | $249,912 | |
| Previous Owner | Wl Homes Llc | $250,000 |
Source: Public Records
Tax History Compared to Growth
Tax History
| Year | Tax Paid | Tax Assessment Tax Assessment Total Assessment is a certain percentage of the fair market value that is determined by local assessors to be the total taxable value of land and additions on the property. | Land | Improvement |
|---|---|---|---|---|
| 2025 | $5,349 | $336,763 | $61,567 | $275,196 |
| 2024 | $5,145 | $330,160 | $60,360 | $269,800 |
| 2023 | $5,057 | $323,687 | $59,177 | $264,510 |
| 2022 | $4,945 | $317,341 | $58,017 | $259,324 |
| 2021 | $4,631 | $289,551 | $56,880 | $232,671 |
| 2020 | $4,568 | $286,583 | $56,297 | $230,286 |
| 2019 | $4,512 | $280,965 | $55,194 | $225,771 |
| 2018 | $4,428 | $275,457 | $54,112 | $221,345 |
| 2017 | $4,412 | $270,056 | $53,051 | $217,005 |
| 2016 | $4,349 | $264,761 | $52,011 | $212,750 |
| 2015 | $4,329 | $260,785 | $51,230 | $209,555 |
| 2014 | $4,298 | $255,678 | $50,227 | $205,451 |
Source: Public Records
Map
Nearby Homes
- 980 Silver Spur Cir Unit 41
- 429 Ranger Ct Unit 111
- 968 Greger St Unit 91
- 886 Ranchland Way
- 562 Ranger St
- 901 Meadowlands Dr
- 1039 Longview Dr
- 557 Stetson Dr
- 1030 Meadowlands Dr Unit MODEL
- Sequoia Plan at The Meadowlands
- Willow Plan at The Meadowlands
- Alder Plan at The Meadowlands
- Ponderosa Plan at The Meadowlands
- Redwood Plan at The Meadowlands
- 1105 W G St
- 596 Hudson Ave
- 1601 W J St
- 24 N Bryan Ave
- 325 W H St
- 64 School Ave
- 503 Clydesdale Ct
- 519 Clydesdale Ct
- 514 Kiso Ct
- 522 Kiso Ct
- 506 Kiso Ct
- 527 Clydesdale Ct
- 510 Clydesdale Ct
- 530 Kiso Ct
- 518 Clydesdale Ct
- 526 Clydesdale Ct
- 462 Ranger St
- 534 Clydesdale Ct
- 456 Ranger St
- 450 Ranger St
- 468 Ranger St
- 513 Dales Pony Ct
- 505 Dales Pony Ct
- 521 Dales Pony Ct
- 501 Kiso Ct
- 515 Kiso Ct