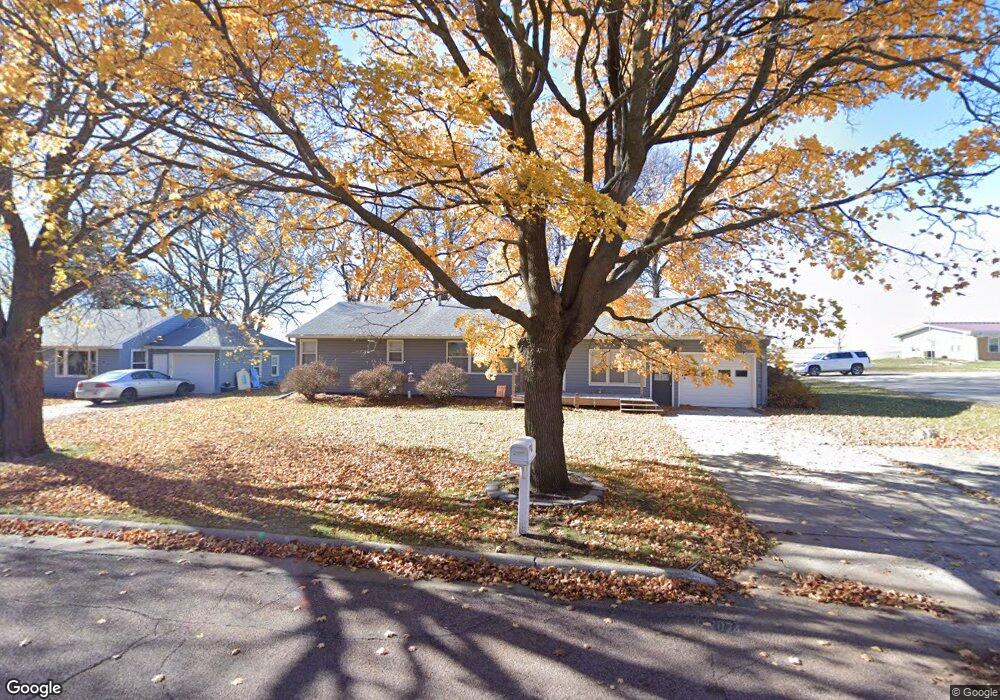
511 Melrose St Wall Lake, IA 51466
Estimated Value: $125,000 - $162,000
--
Bed
2
Baths
1,144
Sq Ft
$121/Sq Ft
Est. Value
About This Home
This home is located at 511 Melrose St, Wall Lake, IA 51466 and is currently estimated at $138,973, approximately $121 per square foot. 511 Melrose St is a home located in Sac County with nearby schools including East Sac County High School.
Ownership History
Date
Name
Owned For
Owner Type
Purchase Details
Closed on
Jan 13, 2025
Sold by
Pfrimmer Toni
Bought by
Lindner Mary B and Olerich David
Current Estimated Value
Purchase Details
Closed on
Jan 18, 2007
Sold by
Polzien Glen W and Polzien Beverly
Bought by
Pfrimmer Toni
Home Financials for this Owner
Home Financials are based on the most recent Mortgage that was taken out on this home.
Original Mortgage
$30,000
Interest Rate
7.5%
Mortgage Type
Assumption
Create a Home Valuation Report for This Property
The Home Valuation Report is an in-depth analysis detailing your home's value as well as a comparison with similar homes in the area
Home Values in the Area
Average Home Value in this Area
Purchase History
| Date | Buyer | Sale Price | Title Company |
|---|---|---|---|
| Lindner Mary B | $125,000 | None Listed On Document | |
| Pfrimmer Toni | -- | None Available |
Source: Public Records
Mortgage History
| Date | Status | Borrower | Loan Amount |
|---|---|---|---|
| Previous Owner | Pfrimmer Toni | $30,000 |
Source: Public Records
Tax History Compared to Growth
Tax History
| Year | Tax Paid | Tax Assessment Tax Assessment Total Assessment is a certain percentage of the fair market value that is determined by local assessors to be the total taxable value of land and additions on the property. | Land | Improvement |
|---|---|---|---|---|
| 2025 | $1,561 | $117,630 | $4,930 | $112,700 |
| 2024 | $1,561 | $105,750 | $4,480 | $101,270 |
| 2023 | $1,152 | $105,750 | $4,480 | $101,270 |
| 2022 | $1,098 | $79,650 | $4,480 | $75,170 |
| 2021 | $1,098 | $79,650 | $4,480 | $75,170 |
| 2020 | $936 | $70,210 | $4,480 | $65,730 |
| 2019 | $948 | $70,210 | $4,480 | $65,730 |
| 2018 | $946 | $68,920 | $0 | $0 |
| 2017 | $946 | $67,410 | $0 | $0 |
| 2016 | $934 | $67,410 | $0 | $0 |
| 2015 | $934 | $65,260 | $0 | $0 |
| 2014 | $906 | $65,260 | $0 | $0 |
Source: Public Records
Map
Nearby Homes