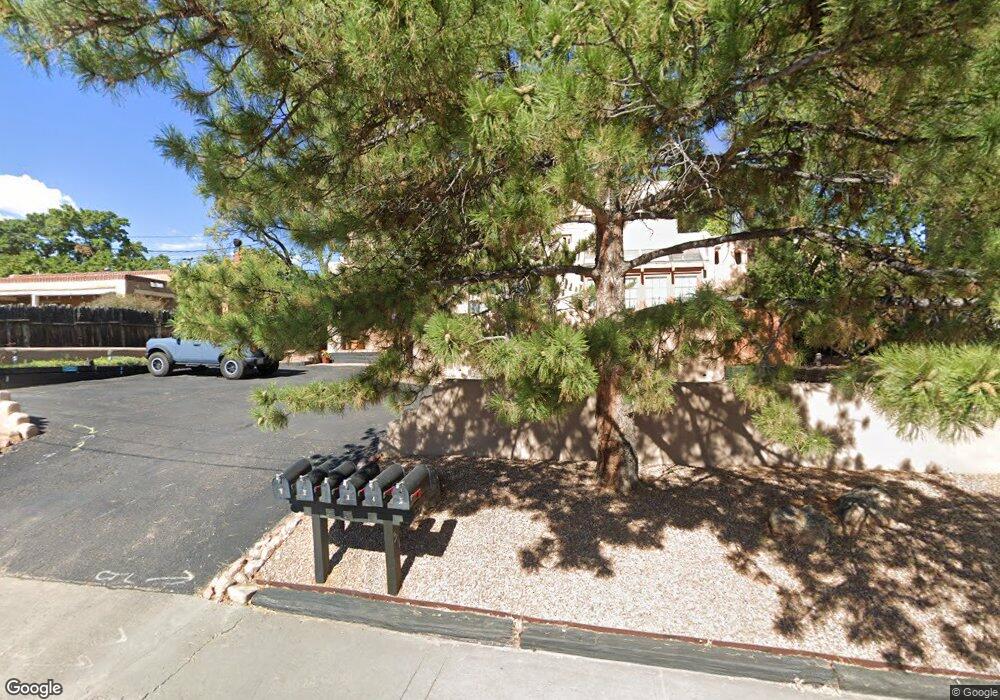
511 Rio Grande Ave Santa Fe, NM 87501
Historic Saint Catherine's NeighborhoodEstimated Value: $682,000 - $877,000
2
Beds
1
Bath
1,504
Sq Ft
$506/Sq Ft
Est. Value
About This Home
This home is located at 511 Rio Grande Ave, Santa Fe, NM 87501 and is currently estimated at $761,763, approximately $506 per square foot. 511 Rio Grande Ave is a home located in Santa Fe County with nearby schools including Carlos Gilbert Elementary School, Santa Fe High School, and New Mexico School for the Arts.
Ownership History
Date
Name
Owned For
Owner Type
Purchase Details
Closed on
Feb 18, 2019
Sold by
Carlson John Gregory and Carlson Betty Clark
Bought by
Arata Tim and Jones Loretta
Current Estimated Value
Purchase Details
Closed on
Jun 29, 2009
Sold by
Mathews Roberta M
Bought by
Carlson John Gregory and Carlson Betty Glacel
Home Financials for this Owner
Home Financials are based on the most recent Mortgage that was taken out on this home.
Original Mortgage
$175,000
Interest Rate
4.97%
Mortgage Type
Purchase Money Mortgage
Purchase Details
Closed on
Jun 7, 2001
Sold by
Morton Carolyn M and The Carolyn M Morton Trust
Bought by
Mathews Roberta M
Purchase Details
Closed on
Feb 26, 1999
Sold by
Wright Frank S and Wright Joyce
Bought by
Morton Carolyn M
Home Financials for this Owner
Home Financials are based on the most recent Mortgage that was taken out on this home.
Original Mortgage
$137,000
Interest Rate
6.8%
Create a Home Valuation Report for This Property
The Home Valuation Report is an in-depth analysis detailing your home's value as well as a comparison with similar homes in the area
Home Values in the Area
Average Home Value in this Area
Purchase History
| Date | Buyer | Sale Price | Title Company |
|---|---|---|---|
| Arata Tim | -- | None Available | |
| Carlson John Gregory | -- | Rio Grande Title Company Inc | |
| Mathews Roberta M | -- | -- | |
| Morton Carolyn M | -- | -- |
Source: Public Records
Mortgage History
| Date | Status | Borrower | Loan Amount |
|---|---|---|---|
| Previous Owner | Carlson John Gregory | $175,000 | |
| Previous Owner | Morton Carolyn M | $137,000 |
Source: Public Records
Tax History Compared to Growth
Tax History
| Year | Tax Paid | Tax Assessment Tax Assessment Total Assessment is a certain percentage of the fair market value that is determined by local assessors to be the total taxable value of land and additions on the property. | Land | Improvement |
|---|---|---|---|---|
| 2025 | $7,493 | $692,472 | -- | $692,472 |
| 2024 | $4,430 | $581,316 | -- | $581,316 |
| 2023 | $4,430 | $564,385 | $0 | $564,385 |
| 2022 | $4,332 | $547,947 | $0 | $547,947 |
| 2021 | $4,265 | $177,329 | $0 | $177,329 |
| 2020 | $4,137 | $172,165 | $0 | $172,165 |
| 2019 | $3,211 | $131,583 | $0 | $131,583 |
| 2018 | $3,141 | $127,751 | $0 | $127,751 |
| 2017 | $3,062 | $124,030 | $0 | $124,030 |
| 2016 | $2,887 | $120,418 | $0 | $120,418 |
| 2015 | $2,820 | $116,911 | $0 | $116,911 |
| 2014 | $2,652 | $113,392 | $0 | $113,392 |
Source: Public Records
Map
Nearby Homes
- 304 Alegre St
- 604 Griffin St
- 1 Paseo de Peralta Unit A+B
- 501 Rio Grande Ave Unit D6
- 563 Del Norte Ln
- 103 Catron St Unit 62H
- 103 Catron St Unit 60-C
- 103 Catron St Unit 48B
- 103 Catron St Unit 54A
- 103 Catron St Unit 49H
- 103 Catron St Unit 48 E
- 103 Catron St Unit 60-B
- 103 Catron St Unit 61B
- 103 Catron St Unit 48C
- 103 Catron Street 1 8 Share Unit 53G
- 127 Duran St Unit A
- 220 1/2 Mckenzie St
- 534 1/2 W Alameda St
- 604 W Alameda St
- 413 Los Arboles Dr
- 511 Rio Grande Ave
- 511 Rio Grande Ave Unit 3
- 511 Rio Grande Ave
- 511 Rio Grande Ave Unit 5
- 511 Rio Grande Ave Unit 4
- 511 Rio Grande Ave Unit 2
- 511 Rio Grande #3
- 511 Rio Grande Ave #5 Unit 5
- 513 Rio Grande Ave
- 509 Rio Grande Ave
- 509 Rio Grande Ave Unit C
- 509 Rio Grande Ave
- 509 Rio Grande Ave
- 509 Rio Grande Ave
- 509 Rio Grande Ave
- 509 Rio Grande Ave Unit A
- 509 Rio Grande Ave Unit B
- 509 Rio Grande Ave Unit D
- 509 Rio Grande Ave Unit A
- 512 Rio Grande Ave