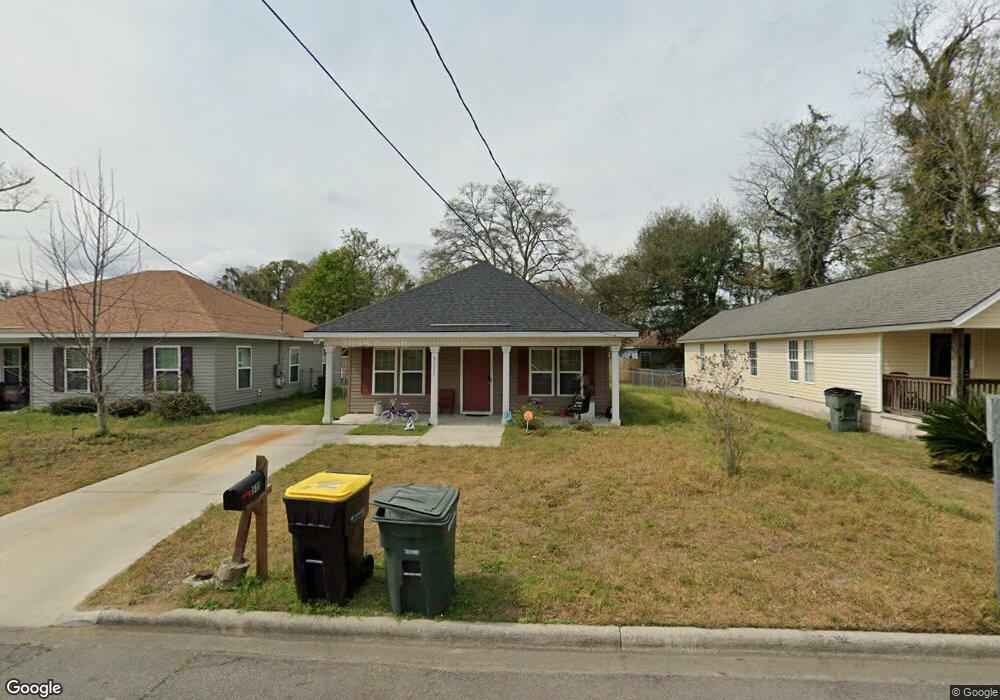
5111 Dancy St Savannah, GA 31405
Feiler Park NeighborhoodEstimated Value: $228,000 - $269,000
3
Beds
2
Baths
1,120
Sq Ft
$218/Sq Ft
Est. Value
About This Home
This home is located at 5111 Dancy St, Savannah, GA 31405 and is currently estimated at $243,986, approximately $217 per square foot. 5111 Dancy St is a home with nearby schools including Haven Elementary School, Myers Middle School, and Beach High School.
Ownership History
Date
Name
Owned For
Owner Type
Purchase Details
Closed on
Sep 26, 2017
Bought by
Mobley Kenisha S
Current Estimated Value
Home Financials for this Owner
Home Financials are based on the most recent Mortgage that was taken out on this home.
Original Mortgage
$104,729
Outstanding Balance
$81,461
Interest Rate
3.82%
Mortgage Type
FHA
Estimated Equity
$162,525
Purchase Details
Closed on
Apr 27, 2017
Sold by
Chatham Of City Of Savannah Land
Bought by
The Coastal Empire Habitat For
Purchase Details
Closed on
Mar 12, 2010
Sold by
Beharry Construction Inc
Bought by
Chatham County City Of Savanna
Purchase Details
Closed on
Dec 1, 2006
Bought by
Chatham County City Of Savanna
Create a Home Valuation Report for This Property
The Home Valuation Report is an in-depth analysis detailing your home's value as well as a comparison with similar homes in the area
Home Values in the Area
Average Home Value in this Area
Purchase History
| Date | Buyer | Sale Price | Title Company |
|---|---|---|---|
| Mobley Kenisha S | $129,000 | -- | |
| The Coastal Empire Habitat For | $18,000 | -- | |
| Chatham County City Of Savanna | $75,000 | -- | |
| Chatham County City Of Savanna | $26,000 | -- |
Source: Public Records
Mortgage History
| Date | Status | Borrower | Loan Amount |
|---|---|---|---|
| Open | Mobley Kenisha S | $104,729 | |
| Closed | Mobley Kenisha S | $10,000 |
Source: Public Records
Tax History Compared to Growth
Tax History
| Year | Tax Paid | Tax Assessment Tax Assessment Total Assessment is a certain percentage of the fair market value that is determined by local assessors to be the total taxable value of land and additions on the property. | Land | Improvement |
|---|---|---|---|---|
| 2025 | $683 | $93,440 | $16,000 | $77,440 |
| 2024 | $683 | $82,640 | $16,000 | $66,640 |
| 2023 | $352 | $74,760 | $8,000 | $66,760 |
| 2022 | $352 | $30,200 | $3,400 | $26,800 |
| 2021 | $924 | $26,080 | $3,400 | $22,680 |
| 2020 | $617 | $26,080 | $3,400 | $22,680 |
| 2019 | $951 | $26,080 | $3,400 | $22,680 |
| 2018 | $0 | $25,160 | $3,400 | $21,760 |
| 2017 | $0 | $3,200 | $3,200 | $0 |
| 2016 | -- | $3,200 | $3,200 | $0 |
| 2015 | -- | $3,200 | $3,200 | $0 |
| 2014 | -- | $3,200 | $0 | $0 |
Source: Public Records
Map
Nearby Homes
- 5126 Dancy St
- 417 South St
- 410 Mckenzie Place
- 5329 Glatigny St
- 331 Sherman Ave
- 4750 Sylvan Dr
- 223 Godsells St
- 207 Godsells St
- 904 Sherman Ave
- 515 W 59th St
- 22 W 61st St
- 23 E 65th St
- 4206 Crane St
- 0 Highway 21 Unit 10607358
- 5 Linden Dr
- 110 E 65th St
- 120 E 66th St
- 130 Brandywine Rd
- 114 E Derenne Ave
- 116 E 66th St