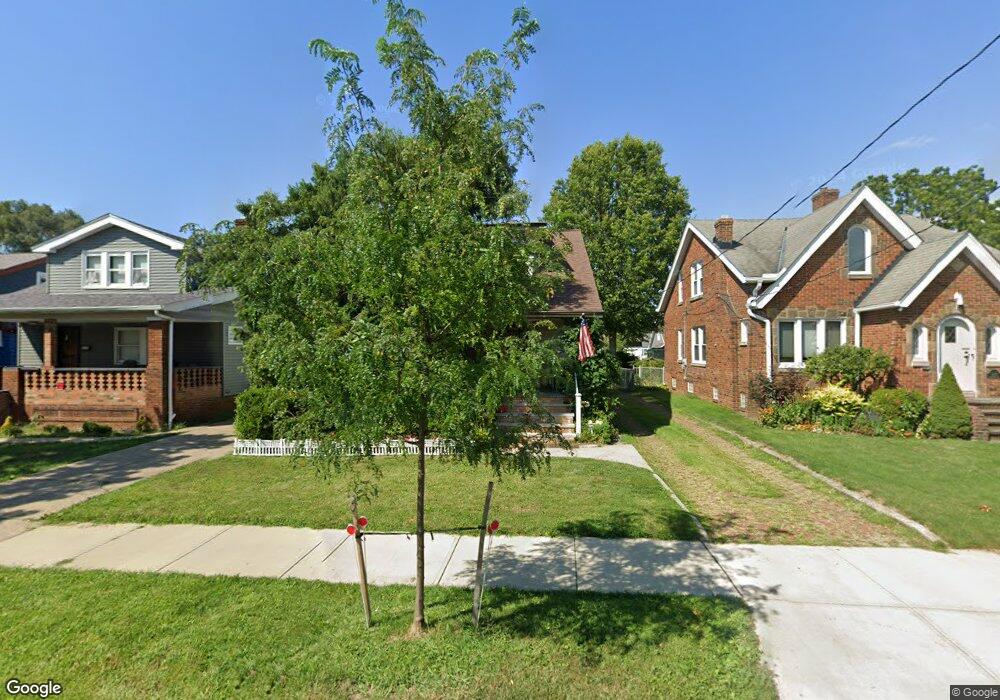
5112 Archmere Ave Cleveland, OH 44144
Old Brooklyn NeighborhoodEstimated Value: $154,000 - $204,000
3
Beds
1
Bath
1,701
Sq Ft
$104/Sq Ft
Est. Value
About This Home
This home is located at 5112 Archmere Ave, Cleveland, OH 44144 and is currently estimated at $176,936, approximately $104 per square foot. 5112 Archmere Ave is a home located in Cuyahoga County with nearby schools including Benjamin Franklin, Almira Academy, and Artemus Ward School.
Ownership History
Date
Name
Owned For
Owner Type
Purchase Details
Closed on
Mar 28, 2015
Sold by
Malinosky Jane J Salontay and Salontay Jane J
Bought by
Malinosky Jane J Salontay
Current Estimated Value
Home Financials for this Owner
Home Financials are based on the most recent Mortgage that was taken out on this home.
Original Mortgage
$40,000
Outstanding Balance
$5,754
Interest Rate
3.68%
Mortgage Type
New Conventional
Estimated Equity
$171,182
Purchase Details
Closed on
May 27, 2009
Sold by
Salontay Jerome J and Salontay Susan S
Bought by
Salontay Jane J
Purchase Details
Closed on
Aug 31, 2005
Sold by
Salontay Margaret E
Bought by
Salontay Jane J
Purchase Details
Closed on
Aug 11, 1986
Sold by
Salontay Margaret E
Bought by
Salontay Margaret E
Purchase Details
Closed on
Jul 2, 1982
Sold by
Salontay Margaret E
Bought by
Margaret E Salontay
Purchase Details
Closed on
Jan 1, 1975
Bought by
Burress Ruth
Create a Home Valuation Report for This Property
The Home Valuation Report is an in-depth analysis detailing your home's value as well as a comparison with similar homes in the area
Home Values in the Area
Average Home Value in this Area
Purchase History
| Date | Buyer | Sale Price | Title Company |
|---|---|---|---|
| Malinosky Jane J Salontay | -- | None Available | |
| Salontay Jane J | $35,000 | Attorney | |
| Salontay Jane J | -- | Attorney | |
| Salontay Margaret E | $3,500 | -- | |
| Margaret E Salontay | $14,300 | -- | |
| Fenner Marcia | -- | -- | |
| Salontay Margaret E | $14,300 | -- | |
| Burress Ruth | -- | -- |
Source: Public Records
Mortgage History
| Date | Status | Borrower | Loan Amount |
|---|---|---|---|
| Open | Malinosky Jane J Salontay | $40,000 |
Source: Public Records
Tax History Compared to Growth
Tax History
| Year | Tax Paid | Tax Assessment Tax Assessment Total Assessment is a certain percentage of the fair market value that is determined by local assessors to be the total taxable value of land and additions on the property. | Land | Improvement |
|---|---|---|---|---|
| 2024 | $3,453 | $52,675 | $10,255 | $42,420 |
| 2023 | $2,666 | $35,150 | $6,830 | $28,320 |
| 2022 | $2,651 | $35,140 | $6,830 | $28,320 |
| 2021 | $2,624 | $35,140 | $6,830 | $28,320 |
| 2020 | $2,352 | $27,230 | $5,290 | $21,950 |
| 2019 | $2,175 | $77,800 | $15,100 | $62,700 |
| 2018 | $2,162 | $27,230 | $5,290 | $21,950 |
| 2017 | $2,174 | $26,360 | $4,380 | $21,980 |
| 2016 | $2,157 | $26,360 | $4,380 | $21,980 |
| 2015 | -- | $26,360 | $4,380 | $21,980 |
| 2014 | -- | $26,880 | $4,480 | $22,400 |
Source: Public Records
Map
Nearby Homes
- 4701 Burger Ave
- 5637 Flowerdale Ave
- 5701 Stickney Ave
- 4512 Oak Park Ave
- 5901 Delora Ave
- 4506 Bader Ave
- 5902 Vandalia Ave
- 5714 Stickney Ave
- 4405 Bader Ave
- 6025 Northcliff Ave
- 4523 Wetzel Ave
- 6015 Ira Ave
- 5105 Behrwald Ave
- 4315 Stickney Ave
- 6306 Flowerdale Ave
- 6209 Archmere Ave
- 5310 Behrwald Ave
- 3820 Bader Ave
- 3910 Wetzel Ave
- 6508 Delora Ave
- 5116 Archmere Ave
- 5108 Archmere Ave
- 5202 Archmere Ave
- 5104 Archmere Ave
- 5206 Archmere Ave
- 5100 Archmere Ave
- 5113 Vandalia Ave
- 5109 Vandalia Ave
- 5203 Vandalia Ave
- 5203 Vandalia Ave Unit UP
- 5210 Archmere Ave
- 5105 Vandalia Ave
- 5207 Vandalia Ave
- 5014 Archmere Ave
- 5101 Vandalia Ave
- 5211 Vandalia Ave
- 5113 Archmere Ave
- 5109 Archmere Ave
- 5214 Archmere Ave
- 5117 Archmere Ave