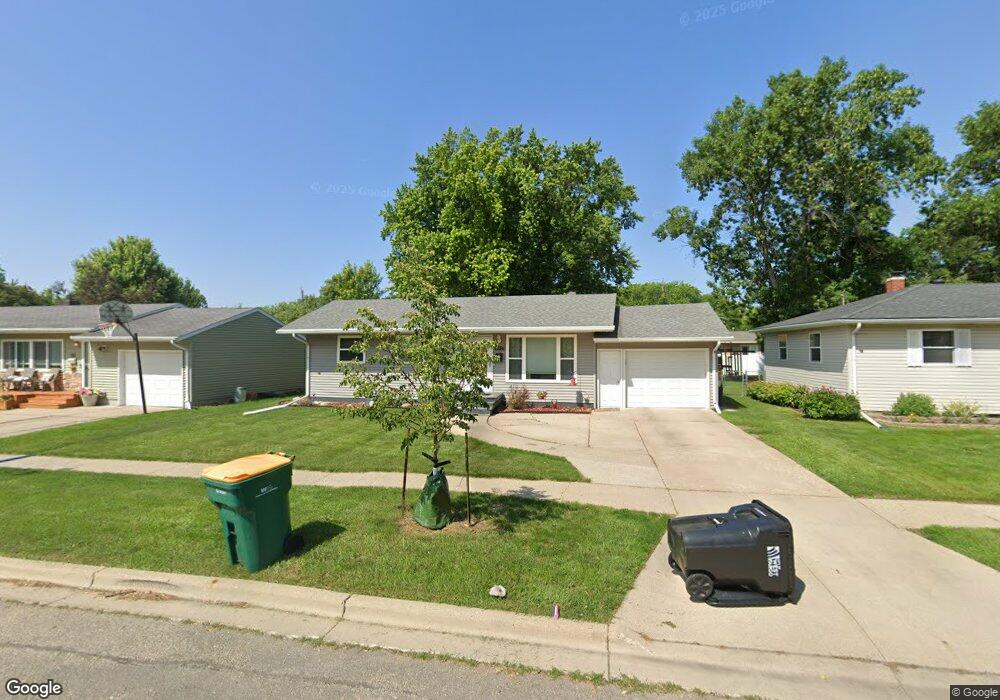
512 3rd St E West Fargo, ND 58078
Sukut's NeighborhoodEstimated Value: $264,000 - $319,958
3
Beds
2
Baths
1,850
Sq Ft
$158/Sq Ft
Est. Value
About This Home
This home is located at 512 3rd St E, West Fargo, ND 58078 and is currently estimated at $291,979, approximately $157 per square foot. 512 3rd St E is a home located in Cass County with nearby schools including South Elementary School, Cheney Middle School, and West Fargo High School.
Ownership History
Date
Name
Owned For
Owner Type
Purchase Details
Closed on
Oct 31, 2017
Sold by
Landen Loretta
Bought by
Haarsager Lesher and Haarsager Nicole
Current Estimated Value
Home Financials for this Owner
Home Financials are based on the most recent Mortgage that was taken out on this home.
Original Mortgage
$206,196
Outstanding Balance
$175,663
Interest Rate
4.5%
Mortgage Type
FHA
Estimated Equity
$116,316
Purchase Details
Closed on
Aug 14, 2017
Sold by
Hanson Jon D and Hanson Lisa
Bought by
Landen Loretta
Purchase Details
Closed on
Jul 17, 2015
Sold by
Broderson Rodney W and Broderson Salina M
Bought by
Hanson Jon D
Create a Home Valuation Report for This Property
The Home Valuation Report is an in-depth analysis detailing your home's value as well as a comparison with similar homes in the area
Home Values in the Area
Average Home Value in this Area
Purchase History
| Date | Buyer | Sale Price | Title Company |
|---|---|---|---|
| Haarsager Lesher | -- | Regency Title | |
| Landen Loretta | $206,000 | None Available | |
| Hanson Jon D | -- | Title Co |
Source: Public Records
Mortgage History
| Date | Status | Borrower | Loan Amount |
|---|---|---|---|
| Open | Haarsager Lesher | $206,196 |
Source: Public Records
Tax History Compared to Growth
Tax History
| Year | Tax Paid | Tax Assessment Tax Assessment Total Assessment is a certain percentage of the fair market value that is determined by local assessors to be the total taxable value of land and additions on the property. | Land | Improvement |
|---|---|---|---|---|
| 2024 | $2,945 | $126,850 | $16,900 | $109,950 |
| 2023 | $3,425 | $125,150 | $16,900 | $108,250 |
| 2022 | $3,275 | $113,900 | $16,900 | $97,000 |
| 2021 | $3,046 | $102,000 | $12,300 | $89,700 |
| 2020 | $3,008 | $102,350 | $12,300 | $90,050 |
| 2019 | $2,900 | $98,400 | $12,300 | $86,100 |
| 2018 | $2,761 | $97,500 | $12,300 | $85,200 |
| 2017 | $2,294 | $81,950 | $12,300 | $69,650 |
| 2016 | $2,038 | $80,100 | $12,300 | $67,800 |
| 2015 | $1,795 | $64,050 | $11,150 | $52,900 |
| 2014 | $1,760 | $59,850 | $11,150 | $48,700 |
| 2013 | $1,672 | $57,550 | $11,150 | $46,400 |
Source: Public Records
Map
Nearby Homes
- 109 7th Ave E
- 109 5th Ave W
- 237 10th Ave E
- 426 3rd Ave E
- 209 1st Ave E
- 437 10th Ave E
- 431 Morrison St
- 226 10 1/2 Ave W
- 245 12th Ave E
- 243 12 1 2 Ave E
- 514 7th Ave W
- 336 13th Ave E
- 520 6th Ave W Unit 8
- 670 13th Ave E
- 744 Elm St
- 52 Pinewood Blvd
- 78 Evergreen Cir
- 851 12th Ave E
- 719 5th Ave W
- 232 15th Ave W