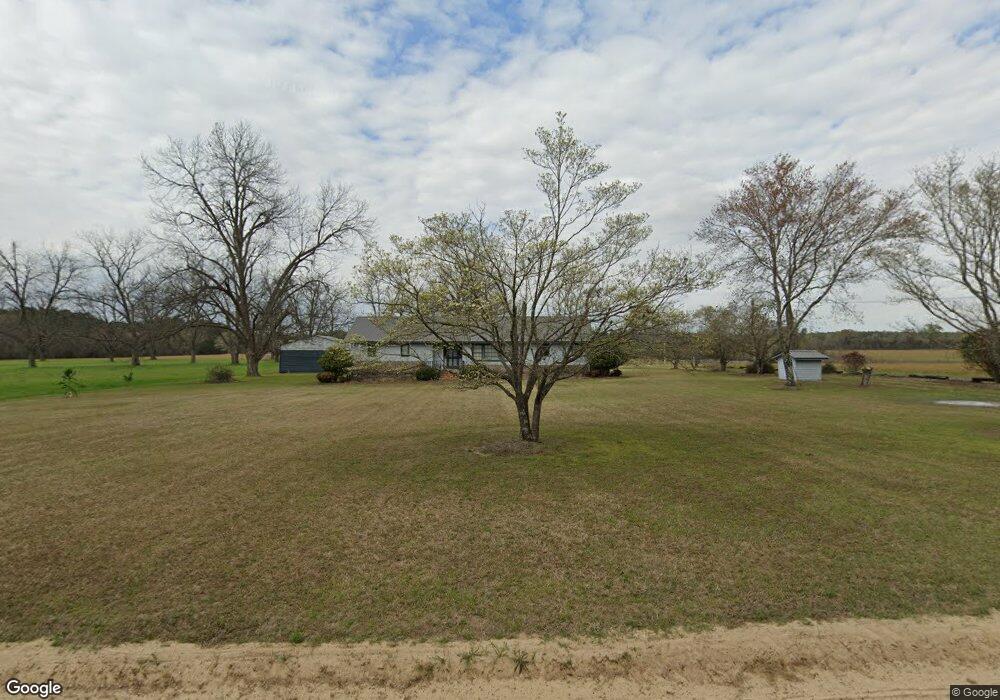
512 Allison Rd Cordele, GA 31015
Estimated Value: $149,616 - $469,000
--
Bed
2
Baths
1,419
Sq Ft
$188/Sq Ft
Est. Value
About This Home
This home is located at 512 Allison Rd, Cordele, GA 31015 and is currently estimated at $266,654, approximately $187 per square foot. 512 Allison Rd is a home located in Crisp County with nearby schools including Crisp County Primary School, Crisp County Elementary School, and Crisp County Middle School.
Ownership History
Date
Name
Owned For
Owner Type
Purchase Details
Closed on
Oct 15, 2020
Sold by
Watson Jason Brent
Bought by
Watson Jason Brent and Watson Cassandra M
Current Estimated Value
Home Financials for this Owner
Home Financials are based on the most recent Mortgage that was taken out on this home.
Original Mortgage
$88,000
Outstanding Balance
$61,318
Interest Rate
2.8%
Mortgage Type
New Conventional
Estimated Equity
$205,336
Purchase Details
Closed on
Feb 19, 2008
Sold by
Watson Gary F
Bought by
Watson Jason Rent
Home Financials for this Owner
Home Financials are based on the most recent Mortgage that was taken out on this home.
Original Mortgage
$101,286
Interest Rate
5.46%
Mortgage Type
New Conventional
Purchase Details
Closed on
Apr 8, 2004
Sold by
Watson Gary F Etal
Bought by
Watson Gary F
Purchase Details
Closed on
Nov 8, 1994
Sold by
Watson Gary F
Bought by
Watson Gary F Etal
Purchase Details
Closed on
Apr 3, 1990
Bought by
Hodge John W
Create a Home Valuation Report for This Property
The Home Valuation Report is an in-depth analysis detailing your home's value as well as a comparison with similar homes in the area
Home Values in the Area
Average Home Value in this Area
Purchase History
| Date | Buyer | Sale Price | Title Company |
|---|---|---|---|
| Watson Jason Brent | -- | -- | |
| Watson Jason Rent | $100,000 | -- | |
| Watson Gary F | -- | -- | |
| Watson Gary F Etal | -- | -- | |
| Watson Gary F | $53,000 | -- | |
| Hodge John W | -- | -- |
Source: Public Records
Mortgage History
| Date | Status | Borrower | Loan Amount |
|---|---|---|---|
| Open | Watson Jason Brent | $88,000 | |
| Previous Owner | Watson Jason Rent | $101,286 |
Source: Public Records
Tax History Compared to Growth
Tax History
| Year | Tax Paid | Tax Assessment Tax Assessment Total Assessment is a certain percentage of the fair market value that is determined by local assessors to be the total taxable value of land and additions on the property. | Land | Improvement |
|---|---|---|---|---|
| 2024 | $1,087 | $42,134 | $1,080 | $41,054 |
| 2023 | $1,081 | $40,487 | $1,080 | $39,407 |
| 2022 | $1,013 | $38,088 | $748 | $37,340 |
| 2021 | $1,068 | $36,022 | $748 | $35,274 |
| 2020 | $1,010 | $36,022 | $748 | $35,274 |
| 2019 | $1,004 | $36,022 | $748 | $35,274 |
| 2018 | $1,032 | $35,712 | $1,470 | $34,242 |
| 2017 | $1,098 | $35,712 | $1,470 | $34,242 |
| 2016 | $1,035 | $35,712 | $1,470 | $34,242 |
| 2015 | -- | $35,711 | $1,470 | $34,242 |
| 2014 | -- | $35,711 | $1,470 | $34,242 |
| 2013 | -- | $35,711 | $1,469 | $34,241 |
Source: Public Records
Map
Nearby Homes
- 141 Ruby St
- 112 Judy Ave
- 118 Joe Wright Drive New Harvest Rd
- TBD Aberdeen Circle Lt# 28
- 2298 U S 41
- 2608 U S 41
- 2776 2776 S Ga 41 Hwy
- 2115 Royal Rd
- 496 Old Albany Rd
- 157 Bobwhite Dr
- 1506 S Joe Wright Dr
- 1606 S 5th St
- 304 Timberland Dr
- 615 E 28th Ave
- 618 E 27th Ave
- 607 E 27th Ave
- 510 E 25th Ave
- 619 E 26th Ave
- 1022 E 29th Ave
- 724 E 26th Ave
- 495 Allison Rd
- 556 Allison Rd
- 469 Allison Rd
- 2621 Pateville Rd
- 2631 Pateville Rd
- 2639 Pateville Rd
- 411 Allison Rd
- 411 Allison Rd
- 0 Allison Rd Unit 8453674
- 150 Rd
- 0 Byrds Mill Rd Unit 8788785
- 0 Byrds Mill Rd
- BYRDS MILL Ga Hwy 300 Rd
- 2585 Culpepper Rd
- 0 S Byrd Mill Rd Unit 59577
- 0 S Byrd Mill Rd Unit 10608406
- 0 Byrd's Mill Rd
- 2525 Culpepper Rd
- 2494 Culpepper Rd
- 2647 Culpepper Rd