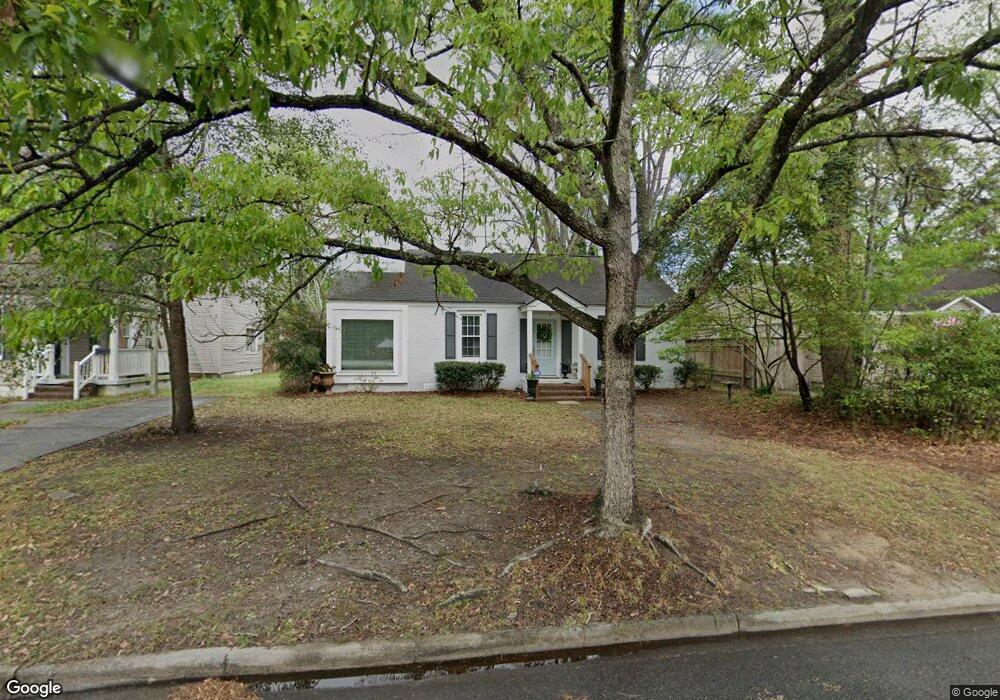
512 E 64th St Savannah, GA 31405
Abercorn Heights-Lamara Heights NeighborhoodEstimated Value: $279,000 - $362,000
2
Beds
1
Bath
980
Sq Ft
$328/Sq Ft
Est. Value
About This Home
This home is located at 512 E 64th St, Savannah, GA 31405 and is currently estimated at $321,856, approximately $328 per square foot. 512 E 64th St is a home located in Chatham County with nearby schools including Jacob G. Smith Elementary School, Myers Middle School, and Jenkins High School.
Ownership History
Date
Name
Owned For
Owner Type
Purchase Details
Closed on
Sep 22, 2025
Sold by
Dycus Diane Maxine Tr
Bought by
512 East 64Th St Sav Llc
Current Estimated Value
Home Financials for this Owner
Home Financials are based on the most recent Mortgage that was taken out on this home.
Original Mortgage
$199,500
Outstanding Balance
$198,784
Interest Rate
6.58%
Mortgage Type
New Conventional
Estimated Equity
$123,072
Purchase Details
Closed on
Dec 19, 2022
Sold by
Dycus Tony Byron
Bought by
Dycus Sean A
Home Financials for this Owner
Home Financials are based on the most recent Mortgage that was taken out on this home.
Original Mortgage
$158,000
Interest Rate
6.58%
Mortgage Type
New Conventional
Purchase Details
Closed on
Mar 12, 2021
Sold by
Dycus Tony
Bought by
The Dycus Family Tr
Purchase Details
Closed on
Aug 31, 2007
Sold by
Not Provided
Bought by
Dycus Sean A and Dycus Tony B
Home Financials for this Owner
Home Financials are based on the most recent Mortgage that was taken out on this home.
Original Mortgage
$72,300
Interest Rate
6.3%
Mortgage Type
New Conventional
Create a Home Valuation Report for This Property
The Home Valuation Report is an in-depth analysis detailing your home's value as well as a comparison with similar homes in the area
Home Values in the Area
Average Home Value in this Area
Purchase History
| Date | Buyer | Sale Price | Title Company |
|---|---|---|---|
| 512 East 64Th St Sav Llc | -- | -- | |
| Dycus Sean A | -- | -- | |
| The Dycus Family Tr | -- | -- | |
| Dycus Sean A | $92,300 | -- |
Source: Public Records
Mortgage History
| Date | Status | Borrower | Loan Amount |
|---|---|---|---|
| Open | 512 East 64Th St Sav Llc | $199,500 | |
| Previous Owner | Dycus Sean A | $158,000 | |
| Previous Owner | Dycus Sean A | $72,300 |
Source: Public Records
Tax History
| Year | Tax Paid | Tax Assessment Tax Assessment Total Assessment is a certain percentage of the fair market value that is determined by local assessors to be the total taxable value of land and additions on the property. | Land | Improvement |
|---|---|---|---|---|
| 2025 | $3,402 | $112,160 | $29,200 | $82,960 |
| 2024 | $20 | $93,480 | $29,200 | $64,280 |
| 2023 | $848 | $69,520 | $29,200 | $40,320 |
| 2022 | $1,396 | $52,040 | $12,800 | $39,240 |
| 2021 | $2,670 | $45,280 | $12,800 | $32,480 |
| 2020 | $2,510 | $41,240 | $12,800 | $28,440 |
| 2019 | $2,606 | $43,240 | $12,800 | $30,440 |
| 2018 | $1,909 | $43,360 | $12,800 | $30,560 |
| 2017 | $1,282 | $43,720 | $12,800 | $30,920 |
| 2016 | $1,198 | $41,080 | $12,800 | $28,280 |
| 2015 | $2,248 | $40,960 | $12,800 | $28,160 |
| 2014 | $2,077 | $37,520 | $0 | $0 |
Source: Public Records
Map
Nearby Homes
- 513 E 64th St
- 513 E 62nd St
- 406 E 63rd St
- 315 E 65th St
- 416 E 61st St
- 602 E 60th St
- 244 E 64th St
- 622 E 60th St
- 223 E 64th St
- 425 Columbus Dr
- 717 E 60th St
- 0 E 70th St Unit SA350287
- 218 E 65th St
- 202 E 64th St
- 407 E 58th St
- 311A Columbus Dr
- 712 Columbus Dr
- 1114 E 59th St
- 1218 E 69th St
- 116 E 66th St
Your Personal Tour Guide
Ask me questions while you tour the home.