
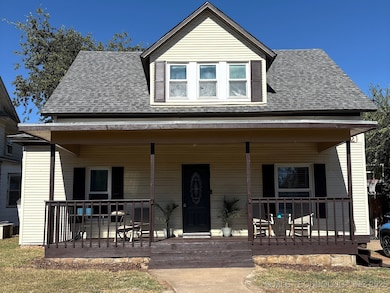
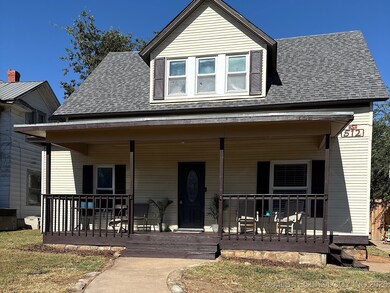
512 E Broadway St Cushing, OK 74023
Estimated payment $701/month
Highlights
- No HOA
- Zoned Heating and Cooling
- South Facing Home
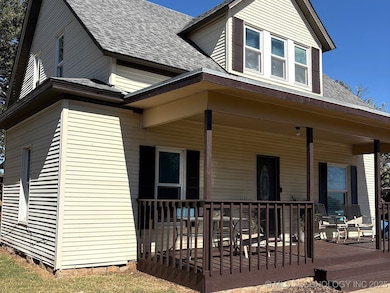
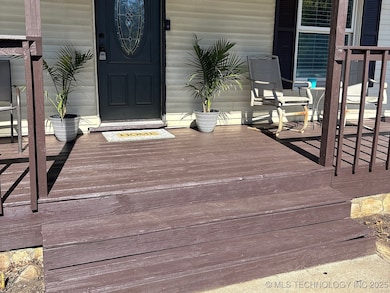
- Covered Patio or Porch
- Ceiling Fan
- Privacy Fence
About This Home
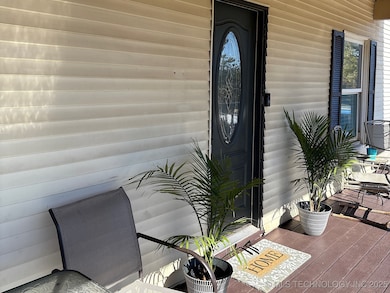
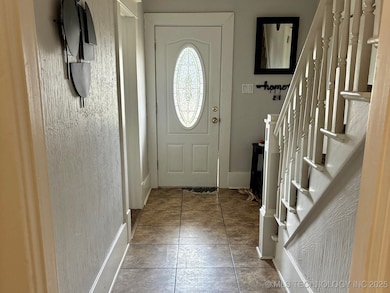
Welcome to 512 Broadway in Cushing Okla, a vintage single-family home with classic character. This home features an inviting front porch where you can sit, relax and enjoy your morning coffee before you start your day. 4 bedrooms, 1.5 baths with a spacious living room that opens to a large dining area. This home boasts a traditional floor plan which includes a spacious bedroom downstairs and the remaining 3 bedrooms upstairs. Home offers a large back yard with a newer privacy fence, which is perfect for entertaining family and friends. Call today for your showing!

Home Details
Home Type
- Single Family
Est. Annual Taxes
- $407
Year Built
- Built in 1920
Lot Details
- 7,000 Sq Ft Lot
- South Facing Home
- Privacy Fence
Parking
- Driveway
Home Design
- Wood Frame Construction
- Fiberglass Roof
- Vinyl Siding
- Asphalt
Interior Spaces
- 1,653 Sq Ft Home
- 2-Story Property
- Ceiling Fan
- Vinyl Clad Windows
- Crawl Space
- Fire and Smoke Detector
- Washer and Electric Dryer Hookup
Kitchen
- Oven
- Range
- Laminate Countertops
Flooring
- Carpet
- Laminate
Bedrooms and Bathrooms
- 4 Bedrooms
Outdoor Features
- Covered Patio or Porch
Schools
- Cushing Elementary And Middle School
- Cushing High School
Utilities
- Zoned Heating and Cooling
- Window Unit Cooling System
- Heating System Uses Gas
- Radiant Heating System
- Gas Water Heater
Community Details
- No Home Owners Association
- Broadway Add Subdivision
Map
Tax History
| Year | Tax Paid | Tax Assessment Tax Assessment Total Assessment is a certain percentage of the fair market value that is determined by local assessors to be the total taxable value of land and additions on the property. | Land | Improvement |
|---|---|---|---|---|
| 2025 | $442 | $5,806 | $397 | $5,409 |
| 2024 | $442 | $5,806 | $397 | $5,409 |
| 2023 | $407 | $5,637 | $480 | $5,157 |
| 2022 | $381 | $5,472 | $550 | $4,922 |
| 2021 | $358 | $5,313 | $570 | $4,743 |
| 2020 | $467 | $6,699 | $570 | $6,129 |
| 2019 | $575 | $7,702 | $536 | $7,166 |
| 2018 | $537 | $7,478 | $521 | $6,957 |
| 2017 | $515 | $7,260 | $535 | $6,725 |
| 2016 | $511 | $7,049 | $527 | $6,522 |
| 2015 | $506 | $6,844 | $519 | $6,325 |
| 2014 | $504 | $6,844 | $519 | $6,325 |
Property History
| Date | Event | Price | List to Sale | Price per Sq Ft |
|---|---|---|---|---|
| 02/17/2026 02/17/26 | Pending | -- | -- | -- |
| 01/29/2026 01/29/26 | Price Changed | $129,900 | -7.1% | $79 / Sq Ft |
| 01/09/2026 01/09/26 | Price Changed | $139,900 | -3.5% | $85 / Sq Ft |
| 11/18/2025 11/18/25 | Price Changed | $145,000 | -1.4% | $88 / Sq Ft |
| 11/17/2025 11/17/25 | Price Changed | $147,000 | -1.7% | $89 / Sq Ft |
| 10/23/2025 10/23/25 | Price Changed | $149,500 | -4.5% | $90 / Sq Ft |
| 10/07/2025 10/07/25 | For Sale | $156,500 | -- | $95 / Sq Ft |
Purchase History
| Date | Type | Sale Price | Title Company |
|---|---|---|---|
| Warranty Deed | $65,000 | None Available | |
| Sheriffs Deed | -- | -- |
Mortgage History
| Date | Status | Loan Amount | Loan Type |
|---|---|---|---|
| Open | $66,326 | New Conventional |
Source: MLS Technology
MLS Number: 2542477
APN: 600008963
Disclaimer: Certain information contained herein is derived from information provided by parties other than Homes.com. All information provided is deemed reliable, but is not guaranteed to be accurate and should be independently verified.
![]() IDX information is provided exclusively for personal, non-commercial use, and may not be used for any purpose other than to identify prospective properties consumers may be interested in purchasing.
IDX information is provided exclusively for personal, non-commercial use, and may not be used for any purpose other than to identify prospective properties consumers may be interested in purchasing.
Information is deemed reliable but not guaranteed.
- 616 E Cherry St
- 708 E Broadway St
- 732 E Broadway St
- 724 E Moses St
- 847 E Moses St
- 103 E Cherry St
- 417 S Harrison Ave
- 919 E 2nd St
- 843 E 4th St
- 228 S Central Ave
- 822 E 6th St
- 1002 E Cherry St
- 828 E 6th St
- 933 E Maple St
- 811 Parkview Dr
- 217 W Maple St
- 413 E 8th St
- 1003 E 4th St
- 835 S Thompson Place
- 1009 E Walnut St
Ask me questions while you tour the home.