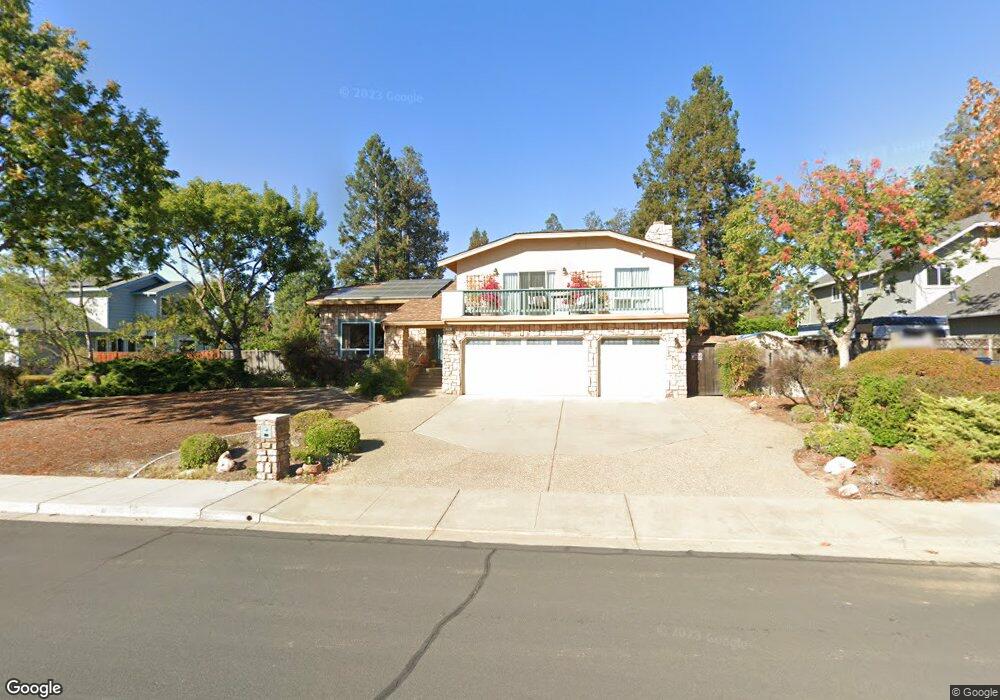
512 Lagrange Ln Livermore, CA 94550
Estimated Value: $1,763,000 - $2,249,000
3
Beds
3
Baths
2,724
Sq Ft
$739/Sq Ft
Est. Value
About This Home
This home is located at 512 Lagrange Ln, Livermore, CA 94550 and is currently estimated at $2,013,890, approximately $739 per square foot. 512 Lagrange Ln is a home located in Alameda County with nearby schools including Emma C. Smith Elementary School, William Mendenhall Middle School, and Granada High School.
Ownership History
Date
Name
Owned For
Owner Type
Purchase Details
Closed on
Aug 13, 2021
Sold by
Pontau Arthur F and Pontau Donna Z
Bought by
Pontau Arthur F and Pontau Donna Z
Current Estimated Value
Home Financials for this Owner
Home Financials are based on the most recent Mortgage that was taken out on this home.
Original Mortgage
$340,000
Outstanding Balance
$212,938
Interest Rate
2.9%
Mortgage Type
New Conventional
Estimated Equity
$1,800,952
Purchase Details
Closed on
Jan 23, 2018
Sold by
Pontau Arthur E and Pontau Donna Zufan
Bought by
Pontau Donna Z and Pontau Arthur E
Create a Home Valuation Report for This Property
The Home Valuation Report is an in-depth analysis detailing your home's value as well as a comparison with similar homes in the area
Purchase History
| Date | Buyer | Sale Price | Title Company |
|---|---|---|---|
| Pontau Arthur F | -- | Chicago Title Company | |
| Pontau Arthur E | -- | Chicago Title Company | |
| Pontau Donna Z | -- | None Available |
Source: Public Records
Mortgage History
| Date | Status | Borrower | Loan Amount |
|---|---|---|---|
| Open | Pontau Arthur E | $340,000 |
Source: Public Records
Tax History
| Year | Tax Paid | Tax Assessment Tax Assessment Total Assessment is a certain percentage of the fair market value that is determined by local assessors to be the total taxable value of land and additions on the property. | Land | Improvement |
|---|---|---|---|---|
| 2025 | $7,223 | $546,189 | $184,201 | $368,988 |
| 2024 | $7,223 | $535,343 | $180,590 | $361,753 |
| 2023 | $7,109 | $531,709 | $177,049 | $354,660 |
| 2022 | $7,001 | $514,285 | $173,578 | $347,707 |
| 2021 | $6,855 | $504,064 | $170,175 | $340,889 |
| 2020 | $6,650 | $505,825 | $168,430 | $337,395 |
| 2019 | $6,673 | $495,908 | $165,128 | $330,780 |
| 2018 | $6,526 | $486,185 | $161,890 | $324,295 |
| 2017 | $6,355 | $476,654 | $158,717 | $317,937 |
| 2016 | $6,114 | $467,309 | $155,605 | $311,704 |
| 2015 | $5,739 | $460,290 | $153,268 | $307,022 |
| 2014 | $5,638 | $451,275 | $150,267 | $301,008 |
Source: Public Records
Map
Nearby Homes
- 2124 Orion Ct
- 2459 French Oak Place
- 1926 Neptune Rd
- 1548 Klondike Place
- 168 Ponte Ct
- 255 Prato Way
- 713 Lido Dr
- 733 Mayview Way
- 221 E Vineyard Ave
- 1147 Lomitas Ave
- 1059 Catalina Dr
- 2889 Bresso Ct
- 637 Caliente Ave
- 2264 Stonebridge Rd
- 1184 Crystal Cir
- 1349 Evans Place
- 563 Cinnabar Dr
- 1835 Cairo St
- 436 Wayland Loop
- 1185 El Dorado Dr
- 520 Lagrange Ln
- 504 Lagrange Ln
- 524 Lagrange Ln
- 513 Regulus Rd
- 517 Regulus Rd
- 1920 Altair Ave
- 501 Lagrange Ln
- 515 Lagrange Ln
- 523 Lagrange Ln
- 521 Regulus Rd
- 538 Lagrange Ln
- 1977 Altair Ave
- 1989 Altair Ave Unit 401
- 531 Lagrange Ln
- 1945 Altair Ave
- 535 Regulus Rd
- 2011 Altair Ave
- 1913 Altair Ave
- 546 Lagrange Ln
- 537 Lagrange Ln
Your Personal Tour Guide
Ask me questions while you tour the home.