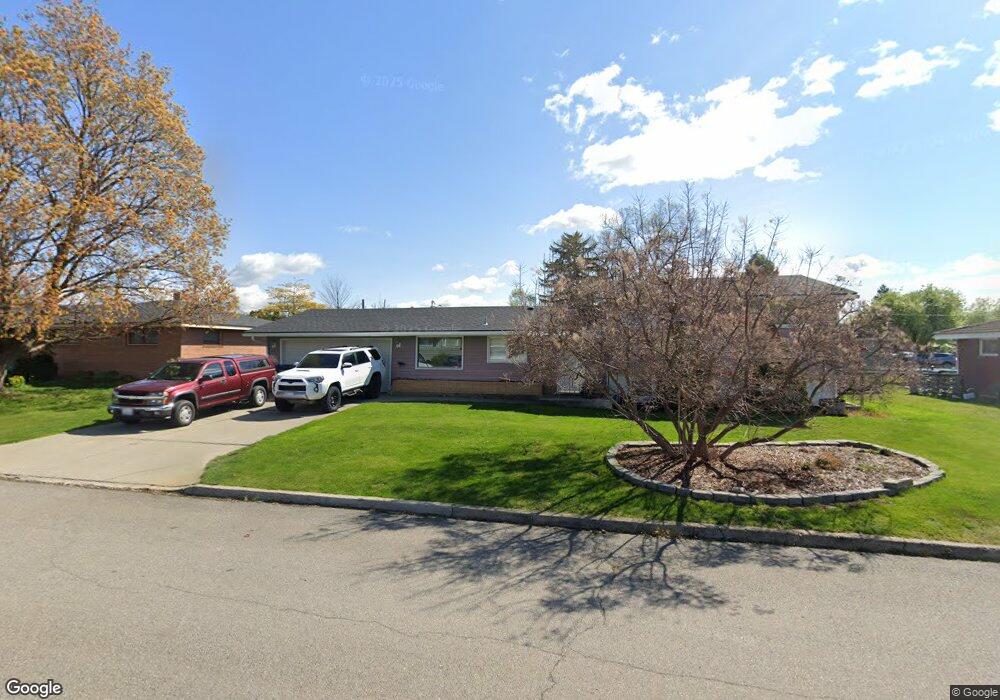
512 N Glenn Rd Spokane Valley, WA 99206
Opportunity NeighborhoodEstimated Value: $397,000 - $422,000
3
Beds
2
Baths
1,900
Sq Ft
$216/Sq Ft
Est. Value
About This Home
This home is located at 512 N Glenn Rd, Spokane Valley, WA 99206 and is currently estimated at $409,518, approximately $215 per square foot. 512 N Glenn Rd is a home located in Spokane County with nearby schools including Broadway Elementary School, North Pines Middle School, and University High School.
Ownership History
Date
Name
Owned For
Owner Type
Purchase Details
Closed on
Jun 22, 2012
Sold by
Hendricks Randolph R
Bought by
Hendricks Michelle L
Current Estimated Value
Home Financials for this Owner
Home Financials are based on the most recent Mortgage that was taken out on this home.
Original Mortgage
$159,030
Outstanding Balance
$109,747
Interest Rate
3.74%
Mortgage Type
FHA
Estimated Equity
$299,771
Purchase Details
Closed on
Nov 19, 2008
Sold by
Wilson Sharyl L and Alvarez Patricia A
Bought by
Hendricks Ii Randolph R and Hendricks Michelle L
Home Financials for this Owner
Home Financials are based on the most recent Mortgage that was taken out on this home.
Original Mortgage
$166,206
Interest Rate
5.9%
Mortgage Type
FHA
Purchase Details
Closed on
Nov 14, 2006
Sold by
Wilson Todd J
Bought by
Wilson Sharyl L and Alvarez Patricia A
Create a Home Valuation Report for This Property
The Home Valuation Report is an in-depth analysis detailing your home's value as well as a comparison with similar homes in the area
Home Values in the Area
Average Home Value in this Area
Purchase History
| Date | Buyer | Sale Price | Title Company |
|---|---|---|---|
| Hendricks Michelle L | -- | First American Title Ins Co | |
| Hendricks Ii Randolph R | $168,400 | Pacific Northwest Title | |
| Wilson Sharyl L | -- | None Available |
Source: Public Records
Mortgage History
| Date | Status | Borrower | Loan Amount |
|---|---|---|---|
| Open | Hendricks Michelle L | $159,030 | |
| Closed | Hendricks Ii Randolph R | $166,206 |
Source: Public Records
Tax History Compared to Growth
Tax History
| Year | Tax Paid | Tax Assessment Tax Assessment Total Assessment is a certain percentage of the fair market value that is determined by local assessors to be the total taxable value of land and additions on the property. | Land | Improvement |
|---|---|---|---|---|
| 2025 | $4,407 | $435,200 | $90,000 | $345,200 |
| 2024 | $4,407 | $413,900 | $75,000 | $338,900 |
| 2023 | $3,709 | $404,300 | $70,000 | $334,300 |
| 2022 | $3,578 | $387,800 | $65,000 | $322,800 |
| 2021 | $3,427 | $274,900 | $40,000 | $234,900 |
| 2020 | $3,058 | $248,900 | $40,000 | $208,900 |
| 2019 | $2,535 | $215,200 | $34,000 | $181,200 |
| 2018 | $2,798 | $197,500 | $34,000 | $163,500 |
| 2017 | $2,601 | $186,800 | $34,000 | $152,800 |
| 2016 | $2,510 | $174,700 | $32,000 | $142,700 |
| 2015 | $2,460 | $168,200 | $32,000 | $136,200 |
| 2014 | -- | $168,000 | $35,000 | $133,000 |
| 2013 | -- | $0 | $0 | $0 |
Source: Public Records
Map
Nearby Homes
- 804 N Pierce Rd
- 11103 E Main Ave
- 10725 E Broadway Ave
- 11302 E Broadway Ave
- 250 N Raymond Rd Unit A9
- 250 N Raymond Rd Unit A-10
- 307 N Raymond Rd Unit 19
- 11512 E Valleyway Ave
- 11504 E Broadway Ave
- 10407 E Main Ave Unit 11
- 10407 E Main Ave Unit 7
- 10321 E Main Ave Unit 301
- 112 N Bowdish Rd
- 419 N Felts Rd
- 1206 N van Marter Rd
- 9809 E Boone Ave
- 11722 E Valleyway Ave
- 1307 N Pierce Rd
- 1011 N Wilbur Rd
- 427 N Union Rd
- 502 N Glenn Rd
- 520 N Glenn Rd
- 11003 E Olive Ave
- 11004 E Alki Ave
- 511 N Glenn Rd
- 519 N Glenn Rd
- 11009 E Olive Ave
- 503 N Glenn Rd
- 11014 E Alki Ave
- 10916 E Olive Ave
- 11004 E Olive Ave
- 11015 E Olive Ave
- 11016 E Alki Ave
- 10908 E Olive Ave
- 11010 E Olive Ave
- 000 E Alki
- 10923 E Valleyway Ave
- 11019 E Olive Ave
- 10915 E Valleyway Ave
- 603 N Glenn Rd