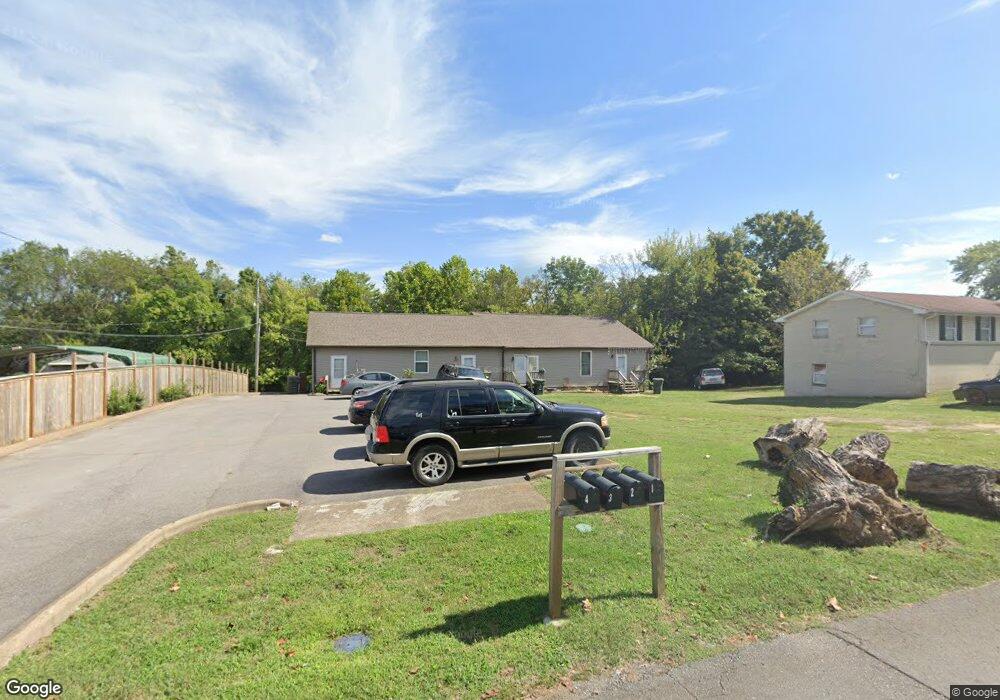
512 S Mabel St Springfield, TN 37172
Estimated Value: $273,000 - $359,000
--
Bed
4
Baths
2,747
Sq Ft
$115/Sq Ft
Est. Value
About This Home
This home is located at 512 S Mabel St, Springfield, TN 37172 and is currently estimated at $315,795, approximately $114 per square foot. 512 S Mabel St is a home with nearby schools including Krisle Elementary School, Innovation Academy, and Springfield High School.
Ownership History
Date
Name
Owned For
Owner Type
Purchase Details
Closed on
Feb 29, 2016
Sold by
Ts Properties Ii Llc Ii
Bought by
Wheeler Curtis and Morgan Keith
Current Estimated Value
Purchase Details
Closed on
Oct 24, 2013
Sold by
Meredith Terri Ellis
Bought by
Ts Properties Ii Llc
Purchase Details
Closed on
Apr 2, 2003
Sold by
Keith Morgan and Keith Linda G
Bought by
Shrewsbury Samuel D and Shrewsbury Terri E
Purchase Details
Closed on
Dec 6, 2000
Sold by
Alford James W
Bought by
Keith Morgan and Keith Linda G
Purchase Details
Closed on
Nov 20, 1995
Bought by
Alford James and Alford Delores
Purchase Details
Closed on
Dec 14, 1992
Bought by
Mantlo James P
Purchase Details
Closed on
Jun 26, 1971
Create a Home Valuation Report for This Property
The Home Valuation Report is an in-depth analysis detailing your home's value as well as a comparison with similar homes in the area
Home Values in the Area
Average Home Value in this Area
Purchase History
| Date | Buyer | Sale Price | Title Company |
|---|---|---|---|
| Wheeler Curtis | $120,000 | -- | |
| Ts Properties Ii Llc | -- | -- | |
| Shrewsbury Samuel D | $55,000 | -- | |
| Keith Morgan | $55,000 | -- | |
| Alford James | $15,000 | -- | |
| Mantlo James P | $15,000 | -- | |
| -- | -- | -- | |
| Fischer James M Jr Tr 1321 Murfreesboro | -- | -- |
Source: Public Records
Tax History Compared to Growth
Tax History
| Year | Tax Paid | Tax Assessment Tax Assessment Total Assessment is a certain percentage of the fair market value that is determined by local assessors to be the total taxable value of land and additions on the property. | Land | Improvement |
|---|---|---|---|---|
| 2024 | -- | $95,840 | $16,000 | $79,840 |
| 2023 | $2,401 | $95,840 | $16,000 | $79,840 |
| 2022 | $2,368 | $64,920 | $13,320 | $51,600 |
| 2021 | $2,368 | $64,920 | $13,320 | $51,600 |
| 2020 | $2,368 | $64,920 | $13,320 | $51,600 |
| 2019 | $71,272 | $64,920 | $13,320 | $51,600 |
| 2018 | $2,368 | $64,920 | $13,320 | $51,600 |
| 2017 | $2,617 | $61,080 | $12,000 | $49,080 |
| 2016 | $2,617 | $61,080 | $12,000 | $49,080 |
| 2015 | $2,541 | $61,080 | $12,000 | $49,080 |
| 2014 | $2,541 | $61,080 | $12,000 | $49,080 |
Source: Public Records
Map
Nearby Homes