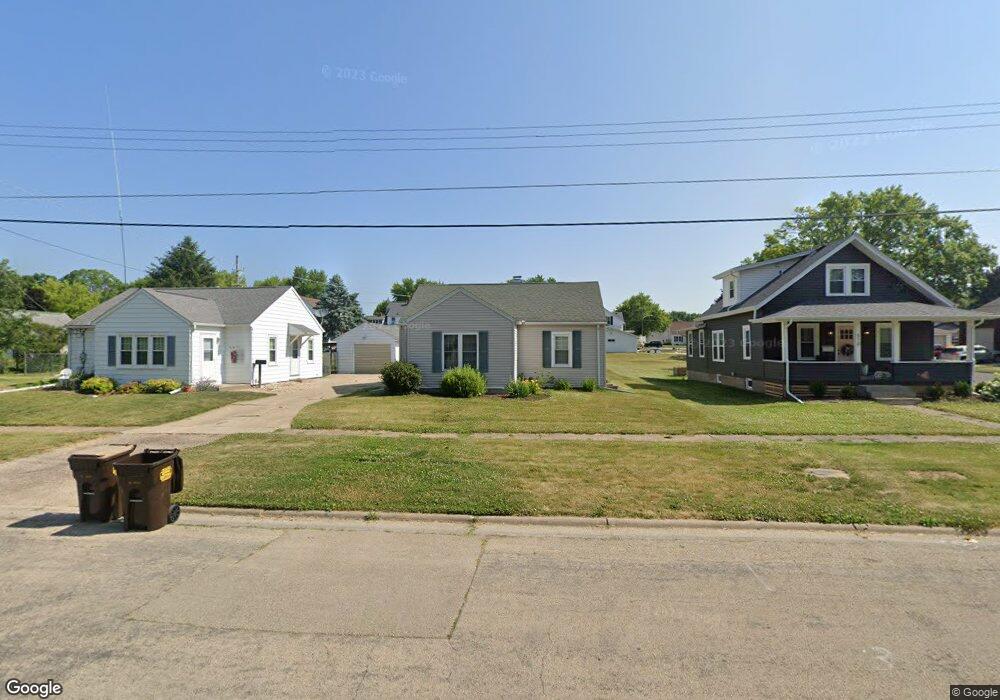
512 W Park St Morrison, IL 61270
Estimated Value: $97,165 - $119,000
2
Beds
1
Bath
944
Sq Ft
$116/Sq Ft
Est. Value
About This Home
This home is located at 512 W Park St, Morrison, IL 61270 and is currently estimated at $109,041, approximately $115 per square foot. 512 W Park St is a home located in Whiteside County with nearby schools including Northside School, Southside School, and Morrison Junior High School.
Ownership History
Date
Name
Owned For
Owner Type
Purchase Details
Closed on
Sep 29, 2023
Sold by
Jones Margaret A
Bought by
Gallentine Brooklyn Faye
Current Estimated Value
Home Financials for this Owner
Home Financials are based on the most recent Mortgage that was taken out on this home.
Original Mortgage
$65,000
Outstanding Balance
$63,281
Interest Rate
6.45%
Mortgage Type
New Conventional
Estimated Equity
$45,760
Purchase Details
Closed on
Jun 10, 2011
Sold by
Porth Kimberly A
Bought by
Jones Margaret A
Home Financials for this Owner
Home Financials are based on the most recent Mortgage that was taken out on this home.
Original Mortgage
$66,442
Interest Rate
4.8%
Mortgage Type
New Conventional
Purchase Details
Closed on
Nov 18, 2005
Sold by
Marinangeli Mark A and Marinangeli Pam
Bought by
Porth Kimberly A
Home Financials for this Owner
Home Financials are based on the most recent Mortgage that was taken out on this home.
Original Mortgage
$57,500
Interest Rate
6.04%
Mortgage Type
New Conventional
Create a Home Valuation Report for This Property
The Home Valuation Report is an in-depth analysis detailing your home's value as well as a comparison with similar homes in the area
Home Values in the Area
Average Home Value in this Area
Purchase History
| Date | Buyer | Sale Price | Title Company |
|---|---|---|---|
| Gallentine Brooklyn Faye | $75,000 | None Listed On Document | |
| Jones Margaret A | $62,500 | None Available | |
| Porth Kimberly A | $57,500 | None Available |
Source: Public Records
Mortgage History
| Date | Status | Borrower | Loan Amount |
|---|---|---|---|
| Open | Gallentine Brooklyn Faye | $65,000 | |
| Previous Owner | Jones Margaret A | $66,442 | |
| Previous Owner | Porth Kimberly A | $57,500 |
Source: Public Records
Tax History
| Year | Tax Paid | Tax Assessment Tax Assessment Total Assessment is a certain percentage of the fair market value that is determined by local assessors to be the total taxable value of land and additions on the property. | Land | Improvement |
|---|---|---|---|---|
| 2024 | $1,750 | $27,447 | $2,261 | $25,186 |
| 2023 | $1,586 | $24,988 | $2,058 | $22,930 |
| 2022 | $1,454 | $23,206 | $1,911 | $21,295 |
| 2021 | $1,406 | $22,724 | $1,871 | $20,853 |
| 2020 | $1,441 | $23,154 | $1,906 | $21,248 |
| 2019 | $1,287 | $21,162 | $1,702 | $19,460 |
| 2018 | $1,334 | $21,067 | $1,694 | $19,373 |
| 2017 | $1,219 | $20,237 | $1,627 | $18,610 |
| 2016 | $1,152 | $19,518 | $1,569 | $17,949 |
| 2015 | $1,221 | $19,995 | $1,607 | $18,388 |
| 2014 | $1,207 | $19,769 | $1,589 | $18,180 |
| 2013 | $1,221 | $19,995 | $1,607 | $18,388 |
Source: Public Records
Map
Nearby Homes
- 411 W Park St
- 617 W Lincolnway
- 814 W Park St
- 402 W Lincolnway
- 301 S Genesee St
- 604 Hillandale Ct
- 308 S Genesee St
- 109 E Morris St
- 105 E Knox St
- 509 S Madison St
- 301 E Wall St
- 302 E Park St
- 503 Portland Ave
- 208 Johnson St
- 403 E Park St
- 400 E Knox St
- 418 E Wall St
- 503 E Main St
- 513 E Main St
- 13629 Garden Plain Rd
Your Personal Tour Guide
Ask me questions while you tour the home.