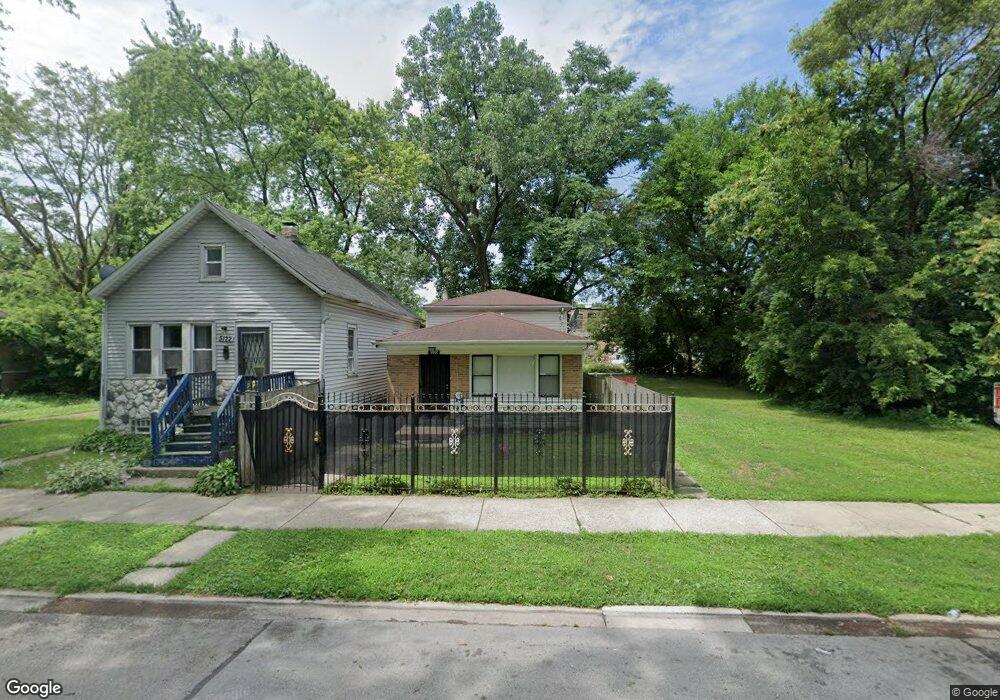
5120 S Emerald Ave Chicago, IL 60609
Back of the Yards NeighborhoodEstimated Value: $137,000 - $216,000
3
Beds
2
Baths
1,000
Sq Ft
$174/Sq Ft
Est. Value
About This Home
This home is located at 5120 S Emerald Ave, Chicago, IL 60609 and is currently estimated at $173,562, approximately $173 per square foot. 5120 S Emerald Ave is a home located in Cook County with nearby schools including Dewey Elementary Academy Of Fine Arts, KIPP Bloom Charter Elementary School, and Visitation Catholic School.
Ownership History
Date
Name
Owned For
Owner Type
Purchase Details
Closed on
Oct 15, 2009
Sold by
Thomas Bennie and Thomas Evelyn
Bought by
Ollins Calvin and Ollins Adelle
Current Estimated Value
Purchase Details
Closed on
Mar 31, 1998
Sold by
Thomas Bennie
Bought by
Thomas Bennie and Thomas Evelyn
Home Financials for this Owner
Home Financials are based on the most recent Mortgage that was taken out on this home.
Original Mortgage
$56,000
Interest Rate
7.19%
Purchase Details
Closed on
Jan 26, 1998
Sold by
Skm Inc
Bought by
Thomas Bennie
Home Financials for this Owner
Home Financials are based on the most recent Mortgage that was taken out on this home.
Original Mortgage
$51,000
Interest Rate
6.99%
Purchase Details
Closed on
Jan 2, 1998
Sold by
Greenwich Time Ltd
Bought by
Skm Inc
Home Financials for this Owner
Home Financials are based on the most recent Mortgage that was taken out on this home.
Original Mortgage
$51,000
Interest Rate
6.99%
Create a Home Valuation Report for This Property
The Home Valuation Report is an in-depth analysis detailing your home's value as well as a comparison with similar homes in the area
Home Values in the Area
Average Home Value in this Area
Purchase History
| Date | Buyer | Sale Price | Title Company |
|---|---|---|---|
| Ollins Calvin | $45,000 | None Available | |
| Thomas Bennie | -- | -- | |
| Thomas Bennie | $70,000 | -- | |
| Skm Inc | $20,000 | -- |
Source: Public Records
Mortgage History
| Date | Status | Borrower | Loan Amount |
|---|---|---|---|
| Previous Owner | Thomas Bennie | $56,000 | |
| Previous Owner | Thomas Bennie | $51,000 |
Source: Public Records
Tax History Compared to Growth
Tax History
| Year | Tax Paid | Tax Assessment Tax Assessment Total Assessment is a certain percentage of the fair market value that is determined by local assessors to be the total taxable value of land and additions on the property. | Land | Improvement |
|---|---|---|---|---|
| 2024 | $1,055 | $11,001 | $938 | $10,063 |
| 2023 | $1,028 | $5,000 | $2,031 | $2,969 |
| 2022 | $1,028 | $5,000 | $2,031 | $2,969 |
| 2021 | $1,005 | $4,999 | $2,031 | $2,968 |
| 2020 | $2,981 | $13,380 | $2,031 | $11,349 |
| 2019 | $2,987 | $14,867 | $2,031 | $12,836 |
| 2018 | $2,937 | $14,867 | $2,031 | $12,836 |
| 2017 | $2,799 | $13,000 | $1,875 | $11,125 |
| 2016 | $2,604 | $13,000 | $1,875 | $11,125 |
| 2015 | $2,382 | $13,000 | $1,875 | $11,125 |
| 2014 | $1,855 | $9,998 | $1,718 | $8,280 |
| 2013 | $1,981 | $10,893 | $1,718 | $9,175 |
Source: Public Records
Map
Nearby Homes
- 738 W 51st St
- 5151 S Emerald Ave
- 5215 S Halsted St
- 5219 S Halsted St
- 840 W 51st Place
- 845 W 50th Place
- 5307 S Emerald Ave
- 848 W 53rd St
- 907 W 50th St
- 947 W 51st St
- 949 W 51st St
- 5302 S Peoria St
- 841 & 843 W 51st Place
- 825 W 51st Place
- 829 W 51st Place
- 5242 S Sangamon St
- 4857 S Union Ave
- 5224 S Morgan St
- 735 W 48th Place
- 817 W 54th St
- 5118 S Emerald Ave
- 5122 S Emerald Ave
- 5130 S Emerald Ave
- 5132 S Emerald Ave
- 5108 S Emerald Ave
- 5106 S Emerald Ave
- 5138 S Emerald Ave
- 5111 S Halsted St
- 5123 S Emerald Ave
- 5117 S Emerald Ave
- 5100 S Emerald Ave
- 5127 S Emerald Ave
- 5140 S Emerald Ave
- 5129 S Emerald Ave
- 5115 S Emerald Ave
- 5131 S Emerald Ave
- 5111 S Emerald Ave
- 5142 S Emerald Ave
- 5135 S Emerald Ave
- 5137 S Emerald Ave