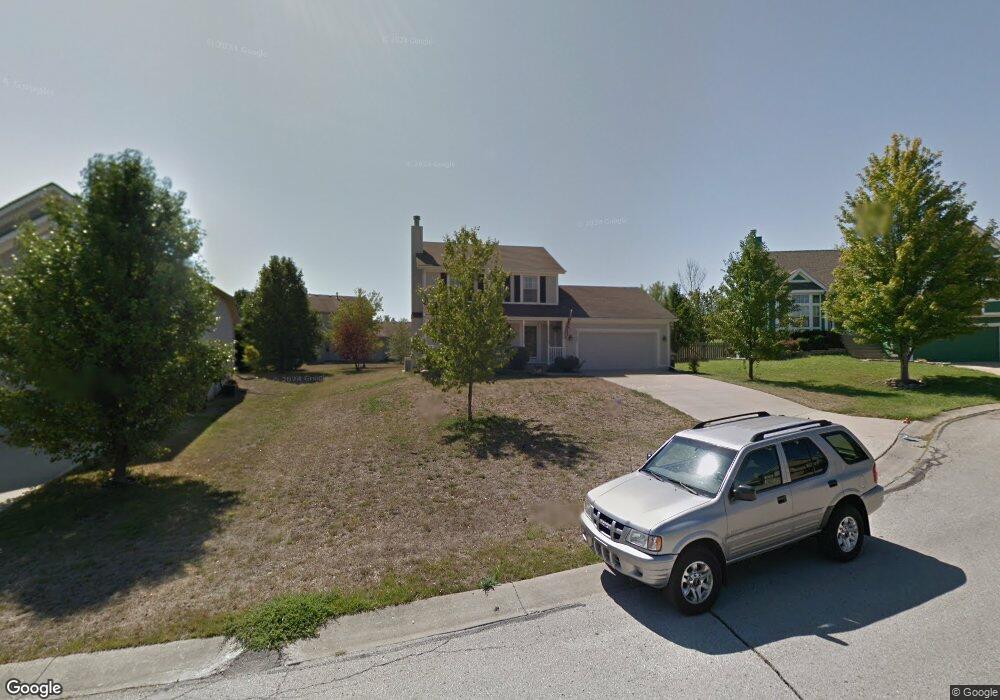
5121 Noreston St Shawnee, KS 66226
Estimated Value: $390,000 - $413,276
3
Beds
4
Baths
1,419
Sq Ft
$282/Sq Ft
Est. Value
About This Home
This home is located at 5121 Noreston St, Shawnee, KS 66226 and is currently estimated at $400,569, approximately $282 per square foot. 5121 Noreston St is a home located in Johnson County with nearby schools including Clear Creek Elementary School, Monticello Trails Middle School, and Mill Valley High School.
Ownership History
Date
Name
Owned For
Owner Type
Purchase Details
Closed on
Mar 28, 2008
Sold by
Phillips Joshua L and Phillips Kristi A
Bought by
Duby Lindsey Y and Duby Hannah E
Current Estimated Value
Purchase Details
Closed on
Apr 26, 2004
Sold by
Livingston Jeremy A and Livingston Tracy M
Bought by
Phillips Joshua L and Phillips Kristi A
Home Financials for this Owner
Home Financials are based on the most recent Mortgage that was taken out on this home.
Original Mortgage
$171,484
Interest Rate
5.42%
Mortgage Type
FHA
Purchase Details
Closed on
Sep 24, 2001
Sold by
Livingston Jeremy A and Livingston Tracy M
Bought by
Livingston Jeremy A and Livingston Tracy M
Home Financials for this Owner
Home Financials are based on the most recent Mortgage that was taken out on this home.
Original Mortgage
$124,000
Interest Rate
6.88%
Create a Home Valuation Report for This Property
The Home Valuation Report is an in-depth analysis detailing your home's value as well as a comparison with similar homes in the area
Home Values in the Area
Average Home Value in this Area
Purchase History
| Date | Buyer | Sale Price | Title Company |
|---|---|---|---|
| Duby Lindsey Y | -- | First American Title Ins Co | |
| Phillips Joshua L | -- | Parkway Title | |
| Livingston Jeremy A | -- | Security Land Title Company |
Source: Public Records
Mortgage History
| Date | Status | Borrower | Loan Amount |
|---|---|---|---|
| Previous Owner | Phillips Joshua L | $171,484 | |
| Previous Owner | Livingston Jeremy A | $124,000 |
Source: Public Records
Tax History Compared to Growth
Tax History
| Year | Tax Paid | Tax Assessment Tax Assessment Total Assessment is a certain percentage of the fair market value that is determined by local assessors to be the total taxable value of land and additions on the property. | Land | Improvement |
|---|---|---|---|---|
| 2024 | $4,794 | $41,354 | $7,434 | $33,920 |
| 2023 | $4,557 | $38,790 | $7,434 | $31,356 |
| 2022 | $5,714 | $36,179 | $7,071 | $29,108 |
| 2021 | $3,852 | $30,809 | $6,431 | $24,378 |
| 2020 | $3,490 | $27,646 | $5,598 | $22,048 |
| 2019 | $3,338 | $26,048 | $5,083 | $20,965 |
| 2018 | $3,232 | $25,588 | $5,083 | $20,505 |
| 2017 | $3,166 | $23,885 | $4,256 | $19,629 |
| 2016 | $3,251 | $24,230 | $4,256 | $19,974 |
| 2015 | $3,157 | $23,184 | $4,256 | $18,928 |
| 2013 | -- | $21,125 | $4,256 | $16,869 |
Source: Public Records
Map
Nearby Homes
- 5116 Payne St
- 22014 W 51st St
- 21525 W 51st St
- 5206 Round Prairie St
- 22115 W 51st Terrace
- 21804 W 52nd Terrace
- 5005 Hilltop Dr
- 5307 Noble St
- 21624 W 53rd Terrace
- 21408 W 50th St
- 5402 Roundtree St
- 22014 W 47th Terrace
- 4713 Lone Elm
- 22625 W 49th St
- 5311 Brownridge Dr
- 5408 Aminda St
- 21222 W 48th St
- 22714 W 49th St
- 4754 Lakecrest Dr
- 5405 Lakecrest Dr
- 5117 Noreston St
- 21718 W 51st Terrace
- 5125 Noreston St
- 21722 W 51st Terrace
- 5129 Noreston St
- 5116 Noreston St
- 5122 Noreston St
- 5110 Noreston St
- 21710 W 51st Terrace
- 5128 Noreston St
- 5109 Noreston St
- 21719 W 51st Terrace
- 21905 W 51st Terrace
- 21811 W 51st St
- 5153 Payne St
- 21715 W 51st Terrace
- 5105 Noreston St
- 21711 W 51st Terrace
- 5147 Payne St
- 21706 W 51st Terrace