Estimated Value: $218,000 - $278,000
2
Beds
2
Baths
1,616
Sq Ft
$152/Sq Ft
Est. Value
About This Home
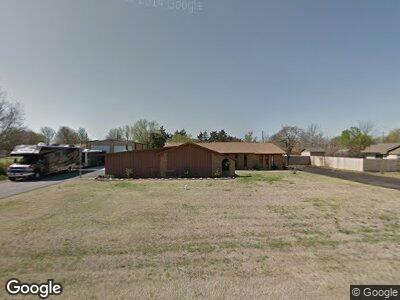
This home is located at 5125 Evandale Dr, Enid, OK 73703 and is currently estimated at $245,667, approximately $152 per square foot. 5125 Evandale Dr is a home located in Garfield County with nearby schools including Hayes Elementary School, Dewitt Waller Middle School, and Enid High School.
Ownership History
Date
Name
Owned For
Owner Type
Purchase Details
Closed on
Jun 4, 2014
Sold by
Busch Darin and Busch Lesli
Bought by
Mouser Joshua D and Mouser Amy M
Current Estimated Value
Home Financials for this Owner
Home Financials are based on the most recent Mortgage that was taken out on this home.
Original Mortgage
$156,000
Interest Rate
4.38%
Mortgage Type
New Conventional
Purchase Details
Closed on
Jul 19, 2010
Sold by
Bainter Lanny M and Bainter Vickie
Bought by
Busch Darin and Busch Leslie
Home Financials for this Owner
Home Financials are based on the most recent Mortgage that was taken out on this home.
Original Mortgage
$132,500
Interest Rate
4.76%
Mortgage Type
Unknown
Purchase Details
Closed on
Apr 10, 2007
Sold by
The Warren L Weir Trust
Bought by
Bainter Vickie and Bainter Lanny M
Purchase Details
Closed on
Oct 19, 2005
Sold by
Weir Warren L
Bought by
Weir Warren L and Warren L Weir Trust
Create a Home Valuation Report for This Property
The Home Valuation Report is an in-depth analysis detailing your home's value as well as a comparison with similar homes in the area
Home Values in the Area
Average Home Value in this Area
Purchase History
| Date | Buyer | Sale Price | Title Company |
|---|---|---|---|
| Mouser Joshua D | $195,000 | Main Street Title | |
| Busch Darin | $135,000 | None Available | |
| Bainter Vickie | $62,500 | None Available | |
| Weir Warren L | -- | None Available | |
| Weir Warren L | -- | None Available |
Source: Public Records
Mortgage History
| Date | Status | Borrower | Loan Amount |
|---|---|---|---|
| Open | Mouser Joshua D | $850,000 | |
| Closed | Mouser Joshua D | $156,000 | |
| Previous Owner | Busch Darin | $150,000 | |
| Previous Owner | Busch Darin | $132,500 | |
| Previous Owner | Weir Warren L | $157,500 |
Source: Public Records
Tax History Compared to Growth
Tax History
| Year | Tax Paid | Tax Assessment Tax Assessment Total Assessment is a certain percentage of the fair market value that is determined by local assessors to be the total taxable value of land and additions on the property. | Land | Improvement |
|---|---|---|---|---|
| 2024 | $2,303 | $22,823 | $3,125 | $19,698 |
| 2023 | $2,303 | $22,823 | $3,125 | $19,698 |
| 2022 | $2,334 | $22,823 | $3,125 | $19,698 |
| 2021 | $2,353 | $23,125 | $3,125 | $20,000 |
| 2020 | $2,623 | $25,098 | $3,125 | $21,973 |
| 2019 | $2,459 | $24,626 | $3,028 | $21,598 |
| 2018 | $2,379 | $23,909 | $3,119 | $20,790 |
| 2017 | $2,296 | $23,213 | $2,967 | $20,246 |
| 2016 | $2,133 | $22,536 | $2,911 | $19,625 |
| 2015 | $2,041 | $21,880 | $2,250 | $19,630 |
| 2014 | $1,934 | $19,784 | $2,250 | $17,534 |
Source: Public Records
Map
Nearby Homes
- 4610 Sandhill
- 4428 Sandhill
- 4410 Sandhill
- 5505 Fountain Head Dr
- 5517 Fountain Head Dr
- 326 Flintridge Rd
- 318 Sombrero Cir
- 113 S Texoma Dr
- 5618 Cedar Ridge Dr
- 113 S Greenleaf Dr
- 4102 S La Mesa Dr
- 5501 Texoma Dr
- 121 N Texoma Dr
- 4313 Cascade St
- 3302 Craftsman Dr
- 117 N Greenleaf Dr
- 213 S Rimrock Rd
- 107 S Cimarron Dr
- 508 Francis St
- 5902 Will Rogers Dr
- 5125 Evandale Dr
- 5201 Evandale Dr
- 5126 Ritchie Ave
- 5101 Evandale Dr
- 5114 Ritchie Ave
- 5202 Ritchie Ave
- 5213 Evandale Dr
- 5102 W Ritchie Ave
- 5102 Ritchie Ave
- 5214 Ritchie Ave
- 5117 Ritchie Ave
- 5201 Ritchie Ave
- 5225 Evandale Dr
- 5101 Ritchie Ave
- 5013 Evandale Dr
- 5014 Ritchie Ave
- 5217 Ritchie Ave
- 5301 Evandale Dr
- 5118 W Rupe Ave
- 5202 W Rupe Ave