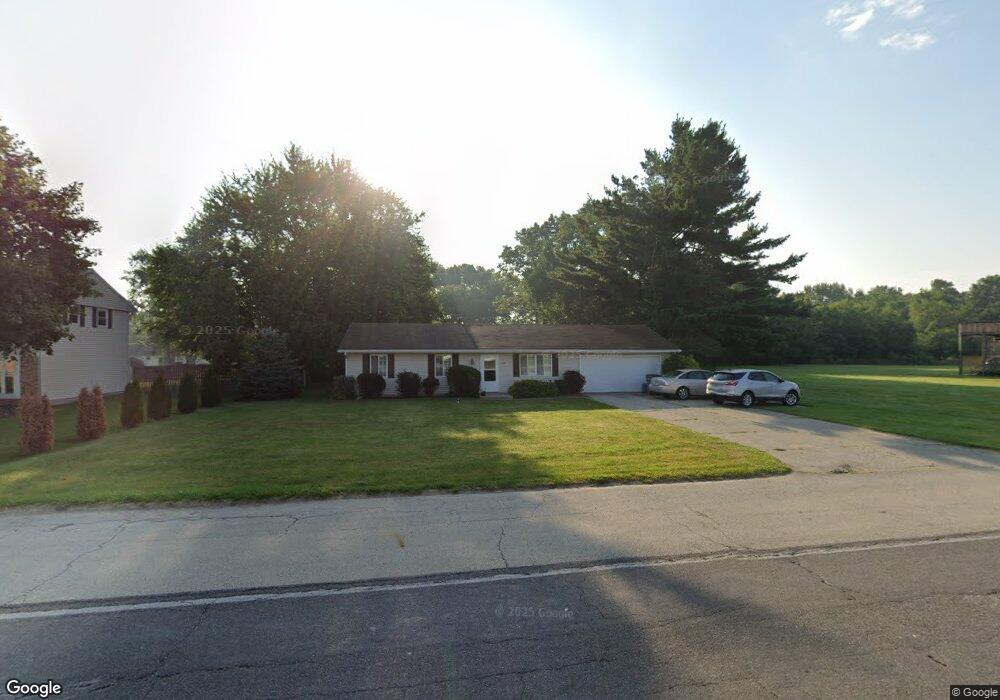
51296 Bittersweet Rd Granger, IN 46530
Estimated Value: $247,848 - $269,000
3
Beds
2
Baths
1,176
Sq Ft
$220/Sq Ft
Est. Value
About This Home
This home is located at 51296 Bittersweet Rd, Granger, IN 46530 and is currently estimated at $259,212, approximately $220 per square foot. 51296 Bittersweet Rd is a home located in St. Joseph County with nearby schools including Horizon Elementary School, Discovery Middle School, and Penn High School.
Ownership History
Date
Name
Owned For
Owner Type
Purchase Details
Closed on
Jun 10, 2009
Sold by
Foulk Jeffrey B
Bought by
Beyler Dudley T and Beyler Peggy K
Current Estimated Value
Home Financials for this Owner
Home Financials are based on the most recent Mortgage that was taken out on this home.
Original Mortgage
$72,750
Interest Rate
4.85%
Mortgage Type
New Conventional
Purchase Details
Closed on
Jan 27, 2009
Sold by
Coe Janie Sue
Bought by
Foulk Jeffrey B
Purchase Details
Closed on
Jul 3, 2007
Sold by
Foulk James B
Bought by
Coe Janie Sue and Foulk Jeffrey B
Purchase Details
Closed on
Jun 26, 2007
Sold by
Kresan Linda
Bought by
Foulk James B
Purchase Details
Closed on
Mar 10, 2006
Sold by
Wuerfel Richard A and Wuerfel Karen A
Bought by
Kresan Linda
Create a Home Valuation Report for This Property
The Home Valuation Report is an in-depth analysis detailing your home's value as well as a comparison with similar homes in the area
Home Values in the Area
Average Home Value in this Area
Purchase History
| Date | Buyer | Sale Price | Title Company |
|---|---|---|---|
| Beyler Dudley T | -- | Meridian Title Corp | |
| Foulk Jeffrey B | -- | Meridian Title Corp | |
| Coe Janie Sue | -- | None Available | |
| Foulk James B | -- | None Available | |
| Kresan Linda | -- | None Available |
Source: Public Records
Mortgage History
| Date | Status | Borrower | Loan Amount |
|---|---|---|---|
| Closed | Beyler Dudley T | $72,750 |
Source: Public Records
Tax History
| Year | Tax Paid | Tax Assessment Tax Assessment Total Assessment is a certain percentage of the fair market value that is determined by local assessors to be the total taxable value of land and additions on the property. | Land | Improvement |
|---|---|---|---|---|
| 2025 | $3,283 | $182,700 | $58,100 | $124,600 |
| 2024 | $3,283 | $179,100 | $58,100 | $121,000 |
| 2023 | $2,700 | $151,500 | $58,100 | $93,400 |
| 2022 | $2,700 | $151,500 | $58,100 | $93,400 |
| 2021 | $2,290 | $117,000 | $15,900 | $101,100 |
| 2020 | $2,132 | $109,400 | $13,900 | $95,500 |
| 2019 | $2,104 | $107,600 | $14,600 | $93,000 |
| 2018 | $2,017 | $104,100 | $13,900 | $90,200 |
| 2017 | $1,726 | $85,400 | $11,700 | $73,700 |
| 2016 | $1,701 | $85,400 | $11,700 | $73,700 |
| 2014 | $1,572 | $73,300 | $9,600 | $63,700 |
Source: Public Records
Map
Nearby Homes
- 51272 Bittersweet Rd
- 12338 Ashland St
- 51633 Bitterly Ct
- 12064 Adams Rd
- 50800 Tumbleweed Trail
- 51866 Columbine Dr
- 51098 Cherry Rd
- 13206 Adams Rd
- 51275 Crooked Oak Dr
- 12793 Brick Rd Unit Lot 4
- 51877 Gentian Ln
- 12983 Brick Rd
- 52070 Olympus Pass
- 51950 Chicory Ln
- 11500 Greyson Alan Dr
- 52118 Olympus Pass
- 52130 Olympus Pass
- 11540 Greyson Alan Dr
- 51150 Mason James Dr
- 52215 Wayne Ct N
- 51264 Bittersweet Rd
- 51340 Bittersweet Rd
- 51255 Arch St
- 51273 Arch St
- 51299 Arch St
- 51270 Bittersweet Rd
- 12444 Ashland St
- 51370 Bittersweet Rd
- 51323 Arch St
- 12420 Ashland St
- 51255 Bittersweet Rd
- 51345 Arch St
- 51367 Arch St
- 51256 Arch St
- 51222 Arch St
- 12463 Ashland St
- 51389 Arch St
- 51300 Arch St
- 12437 Ashland St
- 12366 Ashland St
Your Personal Tour Guide
Ask me questions while you tour the home.