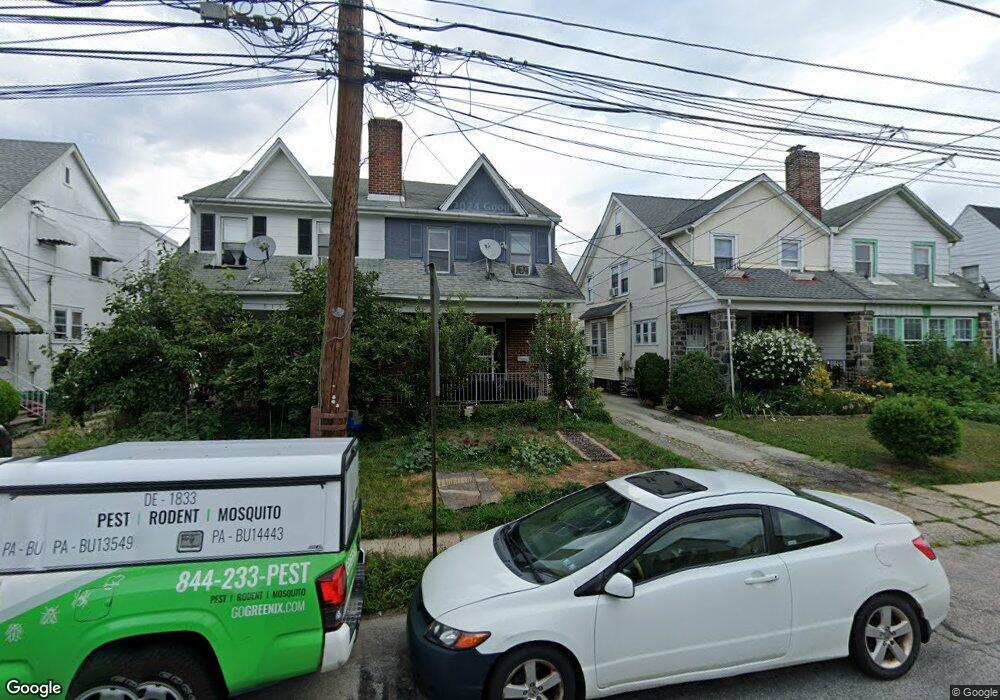
513 Elm Ave Upper Darby, PA 19082
Estimated Value: $229,568 - $254,000
3
Beds
1
Bath
1,352
Sq Ft
$181/Sq Ft
Est. Value
About This Home
This home is located at 513 Elm Ave, Upper Darby, PA 19082 and is currently estimated at $245,142, approximately $181 per square foot. 513 Elm Ave is a home located in Delaware County with nearby schools including Drexel Hill Middle School, Upper Darby High School, and St. Laurence's School.
Ownership History
Date
Name
Owned For
Owner Type
Purchase Details
Closed on
Nov 30, 2020
Sold by
Tran Thom Thi
Bought by
Hossain Md Faruk
Current Estimated Value
Home Financials for this Owner
Home Financials are based on the most recent Mortgage that was taken out on this home.
Original Mortgage
$93,000
Outstanding Balance
$82,798
Interest Rate
2.7%
Mortgage Type
New Conventional
Estimated Equity
$162,344
Purchase Details
Closed on
Feb 26, 2003
Sold by
Nguyen Thanh and Doan Thao N
Bought by
Ho Tuong and Tran Thom Thi
Home Financials for this Owner
Home Financials are based on the most recent Mortgage that was taken out on this home.
Original Mortgage
$70,000
Interest Rate
5.75%
Mortgage Type
Purchase Money Mortgage
Create a Home Valuation Report for This Property
The Home Valuation Report is an in-depth analysis detailing your home's value as well as a comparison with similar homes in the area
Home Values in the Area
Average Home Value in this Area
Purchase History
| Date | Buyer | Sale Price | Title Company |
|---|---|---|---|
| Hossain Md Faruk | $155,000 | Countywide Abstract Lp | |
| Ho Tuong | $90,000 | -- |
Source: Public Records
Mortgage History
| Date | Status | Borrower | Loan Amount |
|---|---|---|---|
| Open | Hossain Md Faruk | $93,000 | |
| Previous Owner | Ho Tuong | $70,000 |
Source: Public Records
Tax History Compared to Growth
Tax History
| Year | Tax Paid | Tax Assessment Tax Assessment Total Assessment is a certain percentage of the fair market value that is determined by local assessors to be the total taxable value of land and additions on the property. | Land | Improvement |
|---|---|---|---|---|
| 2025 | $4,311 | $101,930 | $23,720 | $78,210 |
| 2024 | $4,311 | $101,930 | $23,720 | $78,210 |
| 2023 | $4,270 | $101,930 | $23,720 | $78,210 |
| 2022 | $4,155 | $101,930 | $23,720 | $78,210 |
| 2021 | $5,603 | $101,930 | $23,720 | $78,210 |
| 2020 | $4,838 | $74,790 | $19,980 | $54,810 |
| 2019 | $4,753 | $74,790 | $19,980 | $54,810 |
| 2018 | $4,698 | $74,790 | $0 | $0 |
| 2017 | $4,576 | $74,790 | $0 | $0 |
| 2016 | $410 | $74,790 | $0 | $0 |
| 2015 | $419 | $74,790 | $0 | $0 |
| 2014 | $419 | $74,790 | $0 | $0 |
Source: Public Records
Map
Nearby Homes