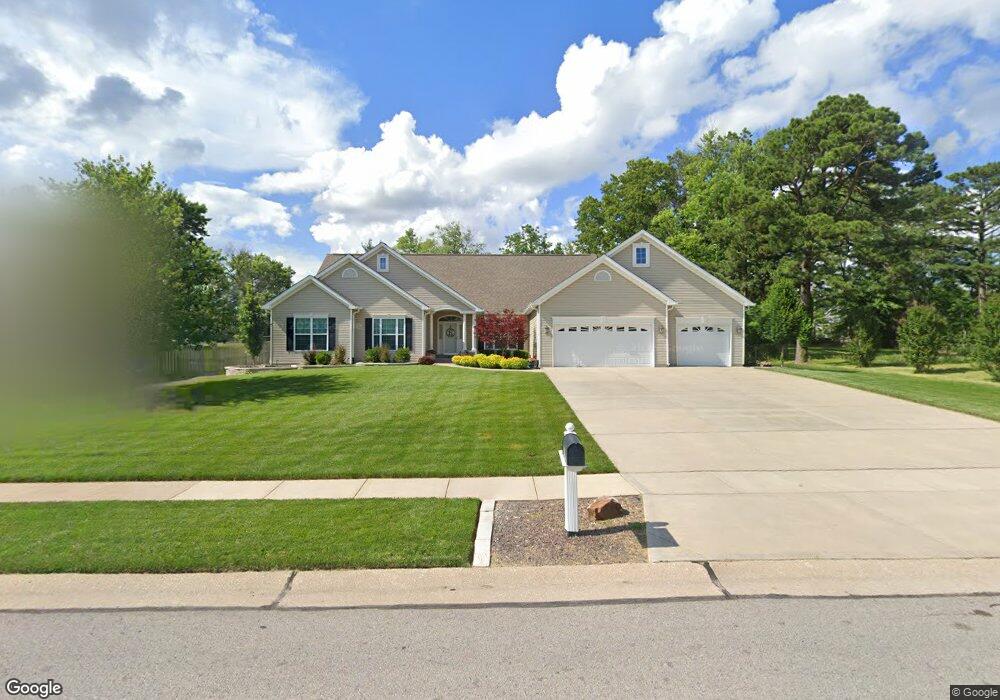
513 Joyce Ann Dr Manchester, MO 63021
Estimated Value: $366,000 - $702,781
3
Beds
2
Baths
2,598
Sq Ft
$233/Sq Ft
Est. Value
About This Home
This home is located at 513 Joyce Ann Dr, Manchester, MO 63021 and is currently estimated at $604,195, approximately $232 per square foot. 513 Joyce Ann Dr is a home with nearby schools including Wren Hollow Elementary School, Parkway Southwest Middle School, and Parkway South High School.
Ownership History
Date
Name
Owned For
Owner Type
Purchase Details
Closed on
Apr 13, 2021
Sold by
Brenton Bruce and Brenton Cheryl
Bought by
Brenton Bruce A and Brenton Cheryl J
Current Estimated Value
Purchase Details
Closed on
Jan 18, 2008
Sold by
Eighteen Investments Inc
Bought by
Brenton Bruce and Brenton Cheryl
Home Financials for this Owner
Home Financials are based on the most recent Mortgage that was taken out on this home.
Original Mortgage
$100,000
Interest Rate
6.42%
Mortgage Type
Purchase Money Mortgage
Purchase Details
Closed on
Nov 20, 2007
Sold by
Mikel Meryle
Bought by
Eighteen Investments Inc
Home Financials for this Owner
Home Financials are based on the most recent Mortgage that was taken out on this home.
Original Mortgage
$100,000
Interest Rate
6.42%
Mortgage Type
Purchase Money Mortgage
Purchase Details
Closed on
Feb 17, 1999
Sold by
Mikel Meryle A
Bought by
Mikel Edward and Mikel Gary
Create a Home Valuation Report for This Property
The Home Valuation Report is an in-depth analysis detailing your home's value as well as a comparison with similar homes in the area
Home Values in the Area
Average Home Value in this Area
Purchase History
| Date | Buyer | Sale Price | Title Company |
|---|---|---|---|
| Brenton Bruce A | -- | None Available | |
| Brenton Bruce | $124,900 | None Available | |
| Eighteen Investments Inc | $103,000 | None Available | |
| Mikel Edward | -- | -- |
Source: Public Records
Mortgage History
| Date | Status | Borrower | Loan Amount |
|---|---|---|---|
| Previous Owner | Eighteen Investments Inc | $100,000 |
Source: Public Records
Tax History Compared to Growth
Tax History
| Year | Tax Paid | Tax Assessment Tax Assessment Total Assessment is a certain percentage of the fair market value that is determined by local assessors to be the total taxable value of land and additions on the property. | Land | Improvement |
|---|---|---|---|---|
| 2025 | $7,420 | $148,270 | $34,880 | $113,390 |
| 2024 | $7,420 | $108,940 | $26,160 | $82,780 |
| 2023 | $7,485 | $108,940 | $26,160 | $82,780 |
| 2022 | $7,371 | $98,650 | $33,480 | $65,170 |
| 2021 | $7,329 | $98,650 | $33,480 | $65,170 |
| 2020 | $7,831 | $100,970 | $28,220 | $72,750 |
| 2019 | $7,721 | $100,970 | $28,220 | $72,750 |
| 2018 | $5,547 | $67,200 | $15,600 | $51,600 |
| 2017 | $5,314 | $67,200 | $15,600 | $51,600 |
| 2016 | $4,736 | $55,630 | $12,480 | $43,150 |
| 2015 | $4,946 | $55,630 | $12,480 | $43,150 |
| 2014 | $4,860 | $60,800 | $8,720 | $52,080 |
Source: Public Records
Map
Nearby Homes
- Wyndham Plan at Sulphur Spring
- Nantucket Plan at Sulphur Spring
- Parkview II Plan at Sulphur Spring
- Waterford II Plan at Sulphur Spring
- Durham II Plan at Sulphur Spring
- Woodside Plan at Sulphur Spring
- Westbrooke Plan at Sulphur Spring
- Arlington II Plan at Sulphur Spring
- Nantucket II Plan at Sulphur Spring
- 312 Whitehall Dr
- 798 Canary Dr
- 417 Chamberlin Dr
- 329 Hillcrest Blvd
- 712 Wildview Ln
- 236 Ballwin Ave
- 405 Lindy Blvd
- 656 Crowsnest Dr
- 17 Roland Ave
- 0 Unknown Unit MIS25060078
- 0 Unknown Unit MIS25060104
- 511 Joyceann Dr
- 515 Joyceann Dr
- 509 Joyce Ann Dr
- 509 Joyceann Dr
- 518 Sulphur Spring Rd
- 514 Joyceann Dr
- 514 Joyce Ann Dr
- 517 Joyceann Dr
- 514 Connie Ln
- 512 Joyceann Dr
- 516 Connie Ln
- 516 Joyceann Dr
- 512 Connie Ln
- 510 Joyceann Dr
- 516 Sulphur Spring Rd
- 518 Connie Ln
- 518 Joyceann Dr
- 602 Sulphur Spring Rd
- 510 Connie Ln
- 520 Connie Ln