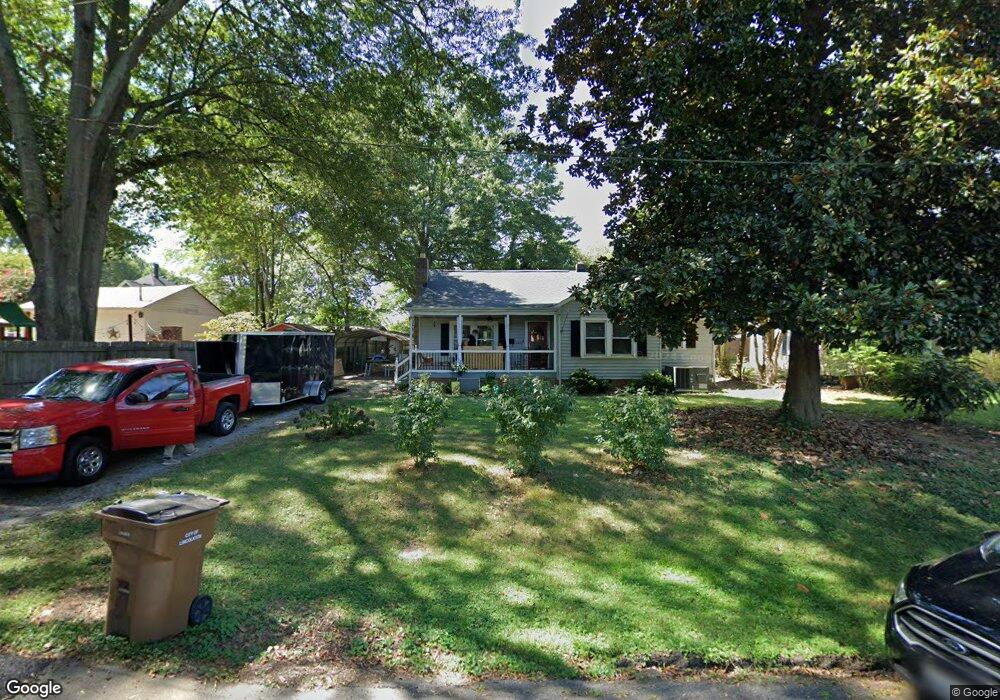
513 Roberta Ave Lincolnton, NC 28092
Estimated Value: $170,000 - $237,000
2
Beds
1
Bath
1,006
Sq Ft
$195/Sq Ft
Est. Value
About This Home
This home is located at 513 Roberta Ave, Lincolnton, NC 28092 and is currently estimated at $196,444, approximately $195 per square foot. 513 Roberta Ave is a home located in Lincoln County with nearby schools including Battleground Elementary School, Lincolnton Middle School, and Lincolnton High School.
Ownership History
Date
Name
Owned For
Owner Type
Purchase Details
Closed on
Jul 24, 2013
Sold by
Putnam Terry Lee and Putnam Frances R
Bought by
Bartley Marcia J and Bartley Bruce C
Current Estimated Value
Purchase Details
Closed on
Sep 21, 2012
Sold by
Allen James and Chapman Erica Lacie
Bought by
Jp Morgan Chase Bank Na
Purchase Details
Closed on
Feb 27, 2007
Sold by
Parker Robert Dennis and Mathis Robert Joseph
Bought by
Allen James and Chapman Erica Lacie
Home Financials for this Owner
Home Financials are based on the most recent Mortgage that was taken out on this home.
Original Mortgage
$90,270
Interest Rate
6.16%
Mortgage Type
New Conventional
Purchase Details
Closed on
Sep 29, 2000
Bought by
Parker Addy Lindsay and Robert Denni
Purchase Details
Closed on
Jul 25, 1995
Bought by
Sain Gerald Mark and Cynthia Bondura
Purchase Details
Closed on
Jan 11, 1995
Bought by
Deal Carrell Todd
Create a Home Valuation Report for This Property
The Home Valuation Report is an in-depth analysis detailing your home's value as well as a comparison with similar homes in the area
Home Values in the Area
Average Home Value in this Area
Purchase History
| Date | Buyer | Sale Price | Title Company |
|---|---|---|---|
| Bartley Marcia J | $78,000 | None Available | |
| Jp Morgan Chase Bank Na | $47,600 | None Available | |
| Allen James | $88,500 | None Available | |
| Parker Addy Lindsay | $62,500 | -- | |
| Sain Gerald Mark | $55,000 | -- | |
| Deal Carrell Todd | $37,000 | -- |
Source: Public Records
Mortgage History
| Date | Status | Borrower | Loan Amount |
|---|---|---|---|
| Previous Owner | Allen James | $90,270 |
Source: Public Records
Tax History Compared to Growth
Tax History
| Year | Tax Paid | Tax Assessment Tax Assessment Total Assessment is a certain percentage of the fair market value that is determined by local assessors to be the total taxable value of land and additions on the property. | Land | Improvement |
|---|---|---|---|---|
| 2025 | $1,718 | $157,925 | $24,700 | $133,225 |
| 2024 | $1,698 | $157,925 | $24,700 | $133,225 |
| 2023 | $1,693 | $157,925 | $24,700 | $133,225 |
| 2022 | $1,232 | $94,770 | $18,000 | $76,770 |
| 2021 | $1,232 | $94,770 | $18,000 | $76,770 |
| 2020 | $1,098 | $94,770 | $18,000 | $76,770 |
| 2019 | $1,098 | $94,770 | $18,000 | $76,770 |
| 2018 | $988 | $75,765 | $17,500 | $58,265 |
| 2017 | $887 | $75,765 | $17,500 | $58,265 |
| 2016 | $887 | $75,765 | $17,500 | $58,265 |
| 2015 | $955 | $75,765 | $17,500 | $58,265 |
| 2014 | $1,030 | $81,784 | $18,500 | $63,284 |
Source: Public Records
Map
Nearby Homes
- 524 Bonview Ave
- 502 Forney Ave
- 327 Bonview Ave
- 411 W Sycamore St
- 801 N Grove St
- 627 W Main St
- 668 Riverside Dr
- 535 Norman Fair Ave
- 316 N Government St
- 743 Lore Rd
- 317 S High St
- 665 S Grove St
- 681 S Grove St
- 689 S Grove St
- 697 S Grove St
- 423 N Cedar St
- 0 N Carolina 182 Unit CAR4246688
- 818 Grier St
- 515 S Academy St
- 329 E Congress St
- 517 Roberta Ave
- 602 Bonview Ave
- 608 Bonview Ave
- 608 Bonview Ave Unit 1
- 609 Louise Ave
- 612 Bonview Ave
- 527 Louise Ave
- 616 Bonview Ave
- 619 Louise Ave
- 610 Louise Ave
- 620 Bonview Ave
- 607 Bonview Ave
- 519 Louise Ave
- 623 Louise Ave
- 616 Louise Ave
- 520 Bonview Ave
- 624 Bonview Ave
- 701 Louise Ave
- 523 Bonview Ave
- 520 Louise Ave