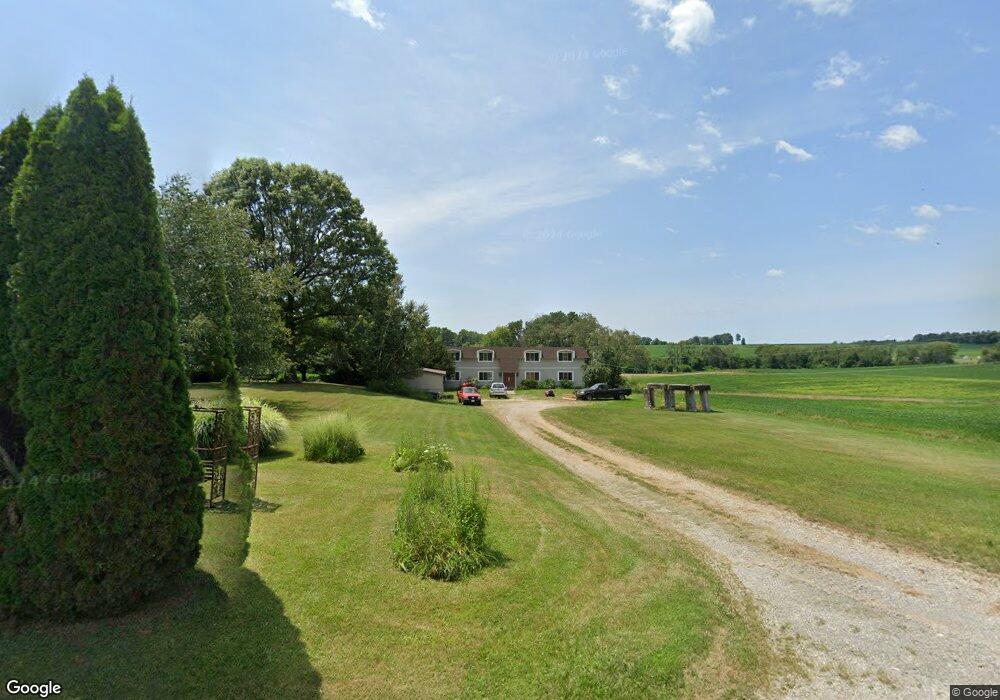
5131 Maple Grove Rd Shreve, OH 44676
Estimated Value: $284,000 - $376,000
8
Beds
5
Baths
3,536
Sq Ft
$91/Sq Ft
Est. Value
About This Home
This home is located at 5131 Maple Grove Rd, Shreve, OH 44676 and is currently estimated at $321,394, approximately $90 per square foot. 5131 Maple Grove Rd is a home located in Wayne County with nearby schools including Triway High School, Sunny Slope C/O Ervin Mast, and Country Corner.
Ownership History
Date
Name
Owned For
Owner Type
Purchase Details
Closed on
Jul 14, 2000
Sold by
Smith Bryon
Bought by
Rex Robert D
Current Estimated Value
Home Financials for this Owner
Home Financials are based on the most recent Mortgage that was taken out on this home.
Original Mortgage
$116,000
Outstanding Balance
$42,449
Interest Rate
8.55%
Mortgage Type
New Conventional
Estimated Equity
$278,945
Purchase Details
Closed on
Dec 23, 1998
Sold by
Smith Brent D
Bought by
Smith Bryon and Smith Margaret
Home Financials for this Owner
Home Financials are based on the most recent Mortgage that was taken out on this home.
Original Mortgage
$83,200
Interest Rate
9.25%
Mortgage Type
New Conventional
Purchase Details
Closed on
Oct 14, 1993
Sold by
Smith Brent D and Sandra Ka
Bought by
Smith Brent D
Purchase Details
Closed on
Mar 23, 1992
Sold by
Jeffers Michael L and Jeffers Mildr
Bought by
Smith Brent D and Sandra Ka
Purchase Details
Closed on
Aug 30, 1988
Sold by
Griffith Russell D
Bought by
Jeffers Michael L and Jeffers Mildr
Create a Home Valuation Report for This Property
The Home Valuation Report is an in-depth analysis detailing your home's value as well as a comparison with similar homes in the area
Home Values in the Area
Average Home Value in this Area
Purchase History
| Date | Buyer | Sale Price | Title Company |
|---|---|---|---|
| Rex Robert D | $130,000 | -- | |
| Smith Bryon | $104,000 | -- | |
| Smith Brent D | -- | -- | |
| Smith Brent D | $110,000 | -- | |
| Jeffers Michael L | $88,700 | -- |
Source: Public Records
Mortgage History
| Date | Status | Borrower | Loan Amount |
|---|---|---|---|
| Open | Rex Robert D | $116,000 | |
| Previous Owner | Smith Bryon | $83,200 |
Source: Public Records
Tax History Compared to Growth
Tax History
| Year | Tax Paid | Tax Assessment Tax Assessment Total Assessment is a certain percentage of the fair market value that is determined by local assessors to be the total taxable value of land and additions on the property. | Land | Improvement |
|---|---|---|---|---|
| 2024 | $2,756 | $79,260 | $12,080 | $67,180 |
| 2023 | $2,756 | $79,260 | $12,080 | $67,180 |
| 2022 | $2,156 | $56,620 | $8,630 | $47,990 |
| 2021 | $2,160 | $56,620 | $8,630 | $47,990 |
| 2020 | $2,186 | $56,620 | $8,630 | $47,990 |
| 2019 | $2,003 | $50,300 | $7,250 | $43,050 |
| 2018 | $2,040 | $50,300 | $7,250 | $43,050 |
| 2017 | $2,033 | $50,300 | $7,250 | $43,050 |
| 2016 | $1,968 | $48,250 | $7,250 | $41,000 |
| 2015 | $1,834 | $48,250 | $7,250 | $41,000 |
| 2014 | $1,835 | $48,250 | $7,250 | $41,000 |
| 2013 | $1,954 | $49,070 | $7,400 | $41,670 |
Source: Public Records
Map
Nearby Homes
- 5163 Maple Grove Rd
- 5225 Maple Grove Rd
- 5050 Maple Grove Rd
- 5030 Maple Grove Rd
- 5272 Maple Grove Rd
- 5287 Maple Grove Rd
- 4970 Maple Grove Rd
- 5100 Maple Grove Rd
- 4940 Maple Grove Rd
- 5343 Maple Grove Rd
- 4900 Maple Grove Rd
- 4990 Maple Grove Rd
- 4858 Maple Grove Rd
- 4824 Maple Grove Rd
- 5000 Maple Grove Rd
- 4804 Maple Grove Rd
- 4774 Maple Grove Rd
- 6373 Wharton Rd
- 4744 Maple Grove Rd
- 6010 Kister Rd