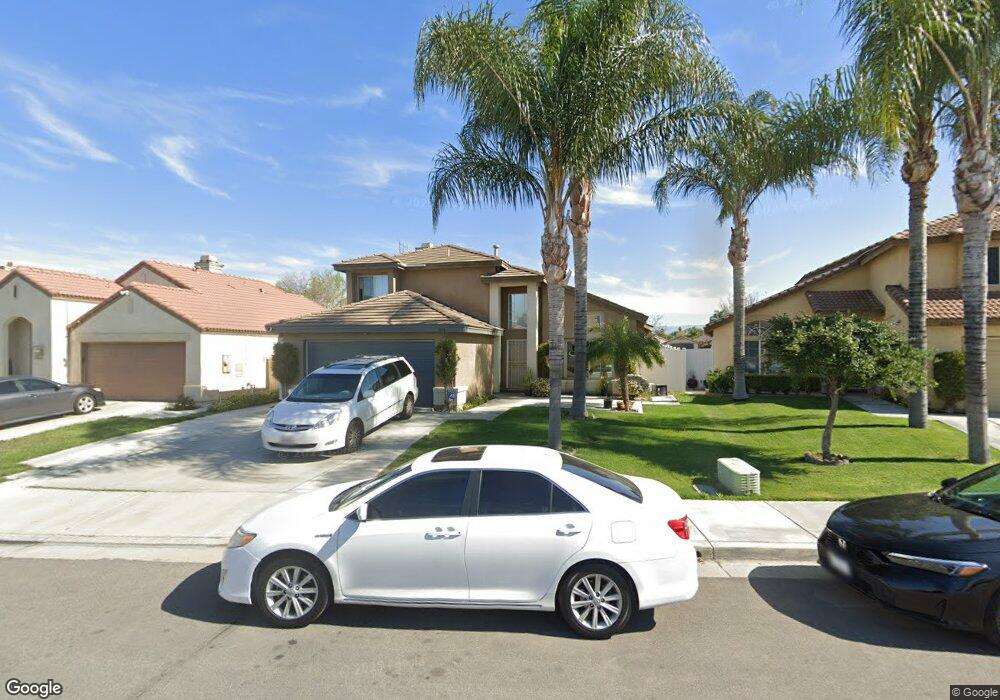
5135 Wenatchee Way Riverside, CA 92509
Rubidoux NeighborhoodEstimated Value: $646,058 - $702,000
4
Beds
3
Baths
1,931
Sq Ft
$348/Sq Ft
Est. Value
About This Home
This home is located at 5135 Wenatchee Way, Riverside, CA 92509 and is currently estimated at $671,515, approximately $347 per square foot. 5135 Wenatchee Way is a home located in Riverside County with nearby schools including Peralta Elementary, Mission Middle School, and Rubidoux High School.
Ownership History
Date
Name
Owned For
Owner Type
Purchase Details
Closed on
Nov 7, 2011
Sold by
Vilalta John and Vilalta Donna
Bought by
Yang Ler and Vue Yer
Current Estimated Value
Home Financials for this Owner
Home Financials are based on the most recent Mortgage that was taken out on this home.
Original Mortgage
$209,000
Outstanding Balance
$141,966
Interest Rate
3.94%
Mortgage Type
New Conventional
Estimated Equity
$529,549
Purchase Details
Closed on
Sep 13, 2002
Sold by
Osborne Development Corp
Bought by
Vilalta John and Vilalta Donna
Home Financials for this Owner
Home Financials are based on the most recent Mortgage that was taken out on this home.
Original Mortgage
$205,025
Interest Rate
6.03%
Mortgage Type
VA
Purchase Details
Closed on
Mar 8, 2002
Sold by
Loring Ranch Llc
Bought by
Osborne Development Corp
Create a Home Valuation Report for This Property
The Home Valuation Report is an in-depth analysis detailing your home's value as well as a comparison with similar homes in the area
Home Values in the Area
Average Home Value in this Area
Purchase History
| Date | Buyer | Sale Price | Title Company |
|---|---|---|---|
| Yang Ler | $220,000 | Fidelity National Title | |
| Vilalta John | $205,500 | Fidelity National Title Co | |
| Osborne Development Corp | -- | Chicago Title Co |
Source: Public Records
Mortgage History
| Date | Status | Borrower | Loan Amount |
|---|---|---|---|
| Open | Yang Ler | $209,000 | |
| Previous Owner | Vilalta John | $205,025 |
Source: Public Records
Tax History Compared to Growth
Tax History
| Year | Tax Paid | Tax Assessment Tax Assessment Total Assessment is a certain percentage of the fair market value that is determined by local assessors to be the total taxable value of land and additions on the property. | Land | Improvement |
|---|---|---|---|---|
| 2025 | $2,958 | $276,316 | $69,074 | $207,242 |
| 2023 | $2,958 | $265,589 | $66,393 | $199,196 |
| 2022 | $2,889 | $260,383 | $65,092 | $195,291 |
| 2021 | $2,873 | $255,278 | $63,816 | $191,462 |
| 2020 | $2,844 | $252,661 | $63,162 | $189,499 |
| 2019 | $2,786 | $247,708 | $61,924 | $185,784 |
| 2018 | $2,695 | $242,852 | $60,711 | $182,141 |
| 2017 | $2,666 | $238,091 | $59,521 | $178,570 |
| 2016 | $2,627 | $233,423 | $58,354 | $175,069 |
| 2015 | $3,029 | $229,920 | $57,479 | $172,441 |
| 2014 | $2,984 | $225,418 | $56,354 | $169,064 |
Source: Public Records
Map
Nearby Homes
- 5191 Westerfield St
- 3825 Crestmore Rd Unit 306
- 3825 Crestmore Rd Unit 414
- 3825 Crestmore Rd Unit 494
- 3825 Crestmore Rd Unit 321
- 3825 Crestmore Rd Unit 480
- 5244 Holstein Way
- 3925 Mennes Ave
- 5442 Mission Blvd
- 4816 Gregory Rd
- 5295 36th St
- 0 35th St Unit SB25168458
- 4687 Knickerbocker Ln
- 3447 Daly Ave
- 5379 35th St
- 4207 Wind Stream Ln
- 4600 9th St
- 4415 12th St
- 5762 Sky Meadow St
- 4830 Palm Ave
- 5141 Wenatchee Way
- 5129 Wenatchee Way
- 5147 Wenatchee Way
- 5123 Wenatchee Way
- 4194 Hidatsa St
- 4203 Papago St
- 4189 Hidatsa St
- 4175 Armistice St
- 5110 Sierra Cross Way
- 4202 Hidatsa St
- 5159 Wenatchee Way
- 5118 Sierra Cross Way
- 4197 Hidatsa St
- 4209 Papago St
- 5126 Sierra Cross Way
- 4165 Armistice St
- 4210 Hidatsa St
- 4205 Hidatsa St
- 5165 Wenatchee Way
- 4215 Papago St