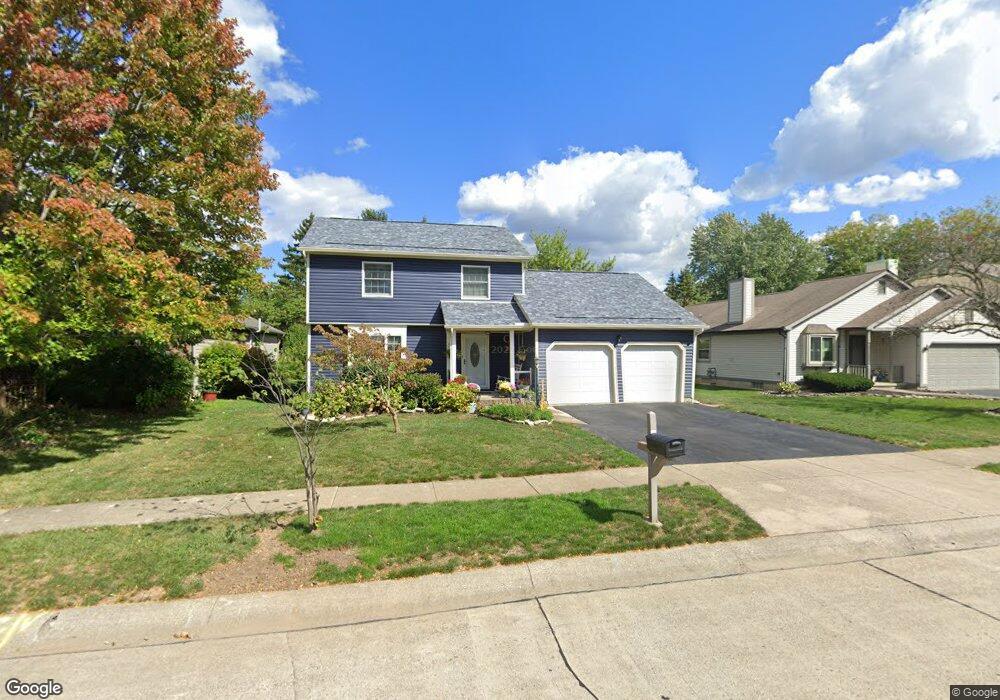
5136 Kinloch Castle Ct Columbus, OH 43221
Dexter Falls NeighborhoodEstimated Value: $380,000 - $403,000
3
Beds
2
Baths
1,586
Sq Ft
$246/Sq Ft
Est. Value
About This Home
This home is located at 5136 Kinloch Castle Ct, Columbus, OH 43221 and is currently estimated at $390,183, approximately $246 per square foot. 5136 Kinloch Castle Ct is a home located in Franklin County with nearby schools including Britton Elementary School, Hilliard Tharp Sixth Grade Elementary School, and Hilliard Weaver Middle School.
Ownership History
Date
Name
Owned For
Owner Type
Purchase Details
Closed on
Oct 12, 2021
Sold by
Slebodnik Mark A
Bought by
Slebodnik Christine E
Current Estimated Value
Purchase Details
Closed on
Jan 11, 1984
Bought by
Slebodnik Mark A
Purchase Details
Closed on
Aug 1, 1983
Create a Home Valuation Report for This Property
The Home Valuation Report is an in-depth analysis detailing your home's value as well as a comparison with similar homes in the area
Home Values in the Area
Average Home Value in this Area
Purchase History
| Date | Buyer | Sale Price | Title Company |
|---|---|---|---|
| Slebodnik Christine E | -- | None Available | |
| Slebodnik Mark A | $74,000 | -- | |
| -- | -- | -- |
Source: Public Records
Tax History Compared to Growth
Tax History
| Year | Tax Paid | Tax Assessment Tax Assessment Total Assessment is a certain percentage of the fair market value that is determined by local assessors to be the total taxable value of land and additions on the property. | Land | Improvement |
|---|---|---|---|---|
| 2024 | $5,974 | $105,770 | $35,420 | $70,350 |
| 2023 | $5,175 | $105,770 | $35,420 | $70,350 |
| 2022 | $4,275 | $69,970 | $28,070 | $41,900 |
| 2021 | $4,271 | $69,970 | $28,070 | $41,900 |
| 2020 | $4,259 | $69,970 | $28,070 | $41,900 |
| 2019 | $4,050 | $56,810 | $23,380 | $33,430 |
| 2018 | $3,836 | $56,810 | $23,380 | $33,430 |
| 2017 | $4,033 | $56,810 | $23,380 | $33,430 |
| 2016 | $3,882 | $50,650 | $14,250 | $36,400 |
| 2015 | $3,638 | $50,650 | $14,250 | $36,400 |
| 2014 | $3,645 | $50,650 | $14,250 | $36,400 |
| 2013 | $1,822 | $49,980 | $13,580 | $36,400 |
Source: Public Records
Map
Nearby Homes
- 3552 Mountshannon Rd
- 3761 Carnforth Dr
- 3873 Tweedsmuir Dr
- 3660 Rivervail Dr
- 3894 Maidens Larne Dr
- 5500 Saddlebrook Dr
- 4664 Cutwater Ln
- 4400 Dublin Rd
- 4898 Davidson Run Dr
- 5049 Dinard Way
- 3940 Rennes Dr
- 3578 Braidwood Dr
- 4390 Dublin Rd
- 5500 Shannon Heights Blvd
- 5506 Shannon Heights Blvd
- 3741 Baybridge Ln
- 3158 Kingsmead Trace Unit 3158
- 5735 Newbank Cir Unit 303
- 5657 Barry Trace
- 5753 Newgate Rd Unit 5753
- 5128 Kinloch Castle Ct
- 5144 Kinloch Castle Ct
- 5152 Kinloch Castle Ct
- 5120 Kinloch Castle Ct
- 5155 Drumcliff Ct
- 5143 Drumcliff Ct
- 5131 Drumcliff Ct
- 5135 Kinloch Castle Ct
- 5127 Kinloch Castle Ct
- 5167 Drumcliff Ct
- 5160 Kinloch Castle Ct
- 5108 Ravenglass Ct
- 3560 Mountshannon Rd
- 5151 Kinloch Castle Ct
- 5159 Kinloch Castle Ct
- 5174 Drumcliff Ct
- 5117 Wainfleet Ct
- 3587 Pinwherry Ct
- 3568 Mountshannon Rd