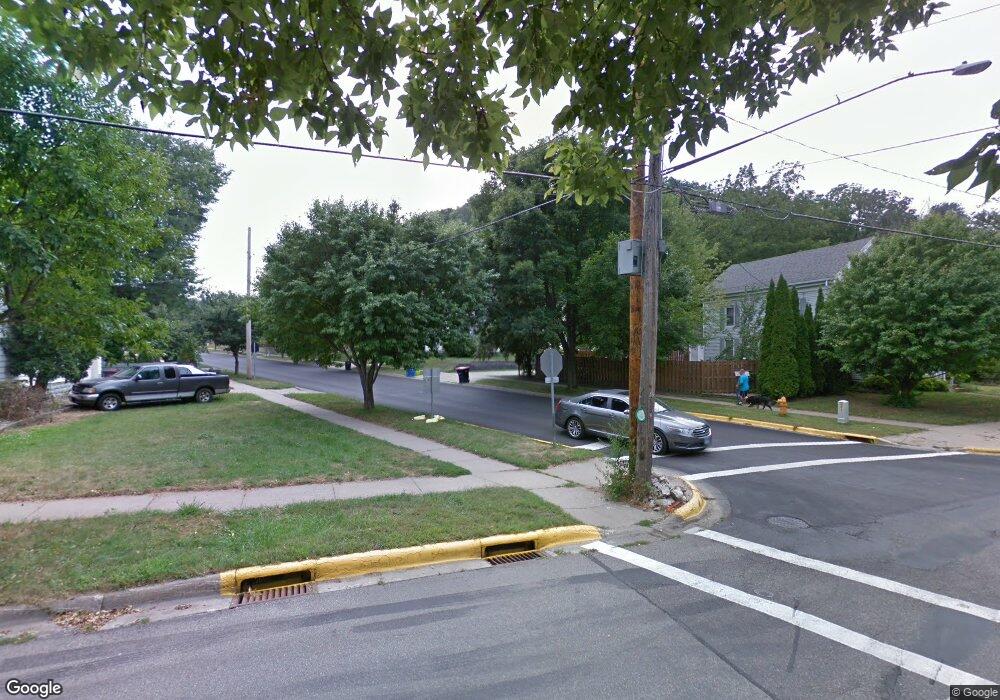
514 12th St Red Wing, MN 55066
Estimated Value: $201,019 - $253,000
3
Beds
2
Baths
1,448
Sq Ft
$158/Sq Ft
Est. Value
About This Home
This home is located at 514 12th St, Red Wing, MN 55066 and is currently estimated at $229,505, approximately $158 per square foot. 514 12th St is a home located in Goodhue County with nearby schools including Sunnyside Elementary School, Burnside Elementary School, and Twin Bluff Middle School.
Ownership History
Date
Name
Owned For
Owner Type
Purchase Details
Closed on
May 26, 2021
Sold by
Christensen Michael and Christensen Kay
Bought by
Burke Thomas
Current Estimated Value
Home Financials for this Owner
Home Financials are based on the most recent Mortgage that was taken out on this home.
Original Mortgage
$138,446
Outstanding Balance
$124,248
Interest Rate
2.9%
Mortgage Type
FHA
Estimated Equity
$105,257
Purchase Details
Closed on
Nov 12, 2002
Sold by
Estate Of Pauline M Rigelman
Bought by
Christensen Michael J and Christensen Kay E
Create a Home Valuation Report for This Property
The Home Valuation Report is an in-depth analysis detailing your home's value as well as a comparison with similar homes in the area
Home Values in the Area
Average Home Value in this Area
Purchase History
| Date | Buyer | Sale Price | Title Company |
|---|---|---|---|
| Burke Thomas | $141,000 | New Title Company Name | |
| Christensen Michael J | $93,000 | -- | |
| Burke Thomas Thomas | $141,000 | -- |
Source: Public Records
Mortgage History
| Date | Status | Borrower | Loan Amount |
|---|---|---|---|
| Open | Burke Thomas | $138,446 | |
| Closed | Burke Thomas Thomas | $138,500 |
Source: Public Records
Tax History
| Year | Tax Paid | Tax Assessment Tax Assessment Total Assessment is a certain percentage of the fair market value that is determined by local assessors to be the total taxable value of land and additions on the property. | Land | Improvement |
|---|---|---|---|---|
| 2025 | -- | $186,300 | $28,800 | $157,500 |
| 2024 | -- | $183,000 | $28,800 | $154,200 |
| 2023 | $2,554 | $171,800 | $28,600 | $143,200 |
| 2022 | $1,876 | $170,700 | $28,600 | $142,100 |
| 2021 | $2,020 | $145,800 | $28,600 | $117,200 |
| 2020 | $2,018 | $136,800 | $28,600 | $108,200 |
| 2019 | $1,990 | $127,500 | $28,600 | $98,900 |
| 2018 | $1,642 | $127,200 | $27,500 | $99,700 |
| 2017 | $1,610 | $111,200 | $27,500 | $83,700 |
| 2016 | $1,486 | $110,300 | $27,500 | $82,800 |
| 2015 | $1,436 | $106,700 | $27,500 | $79,200 |
| 2014 | -- | $102,300 | $27,500 | $74,800 |
Source: Public Records
Map
Nearby Homes
Your Personal Tour Guide
Ask me questions while you tour the home.