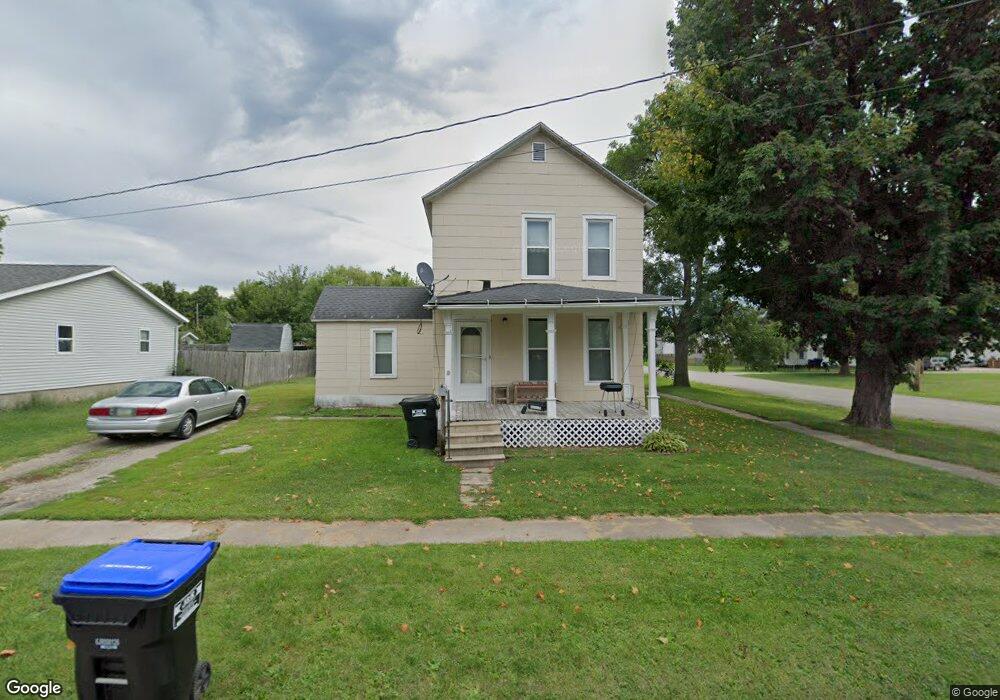
514 S 8th Ave Vinton, IA 52349
Estimated Value: $90,000 - $154,000
2
Beds
1
Bath
1,074
Sq Ft
$109/Sq Ft
Est. Value
About This Home
This home is located at 514 S 8th Ave, Vinton, IA 52349 and is currently estimated at $117,546, approximately $109 per square foot. 514 S 8th Ave is a home located in Benton County with nearby schools including Tilford Elementary School, Vinton-Shellsburg Middle School, and Vinton-Shellsburg High School.
Ownership History
Date
Name
Owned For
Owner Type
Purchase Details
Closed on
Oct 28, 2024
Sold by
Mosher Terry A
Bought by
Mosher Melissa M
Current Estimated Value
Purchase Details
Closed on
Sep 25, 2017
Sold by
Vanree Todd J and Vanree Kellie
Bought by
Mosher Terry A and Mosher Melissa M
Home Financials for this Owner
Home Financials are based on the most recent Mortgage that was taken out on this home.
Original Mortgage
$46,000
Interest Rate
3.86%
Mortgage Type
New Conventional
Create a Home Valuation Report for This Property
The Home Valuation Report is an in-depth analysis detailing your home's value as well as a comparison with similar homes in the area
Home Values in the Area
Average Home Value in this Area
Purchase History
| Date | Buyer | Sale Price | Title Company |
|---|---|---|---|
| Mosher Melissa M | -- | None Listed On Document | |
| Mosher Terry A | -- | None Available |
Source: Public Records
Mortgage History
| Date | Status | Borrower | Loan Amount |
|---|---|---|---|
| Previous Owner | Mosher Terry A | $46,000 |
Source: Public Records
Tax History
| Year | Tax Paid | Tax Assessment Tax Assessment Total Assessment is a certain percentage of the fair market value that is determined by local assessors to be the total taxable value of land and additions on the property. | Land | Improvement |
|---|---|---|---|---|
| 2025 | $1,220 | $71,800 | $15,200 | $56,600 |
| 2024 | $1,220 | $65,100 | $14,500 | $50,600 |
| 2023 | $1,132 | $65,100 | $14,500 | $50,600 |
| 2022 | $1,162 | $52,600 | $11,600 | $41,000 |
| 2021 | $1,162 | $52,600 | $11,600 | $41,000 |
| 2020 | $854 | $39,500 | $11,100 | $28,400 |
| 2019 | $992 | $39,500 | $11,100 | $28,400 |
| 2018 | $1,114 | $45,300 | $10,500 | $34,800 |
| 2017 | $1,114 | $61,000 | $10,500 | $50,500 |
| 2016 | $1,042 | $57,000 | $9,800 | $47,200 |
| 2015 | $1,042 | $57,000 | $9,800 | $47,200 |
| 2014 | $960 | $53,100 | $0 | $0 |
Source: Public Records
Map
Nearby Homes
Your Personal Tour Guide
Ask me questions while you tour the home.