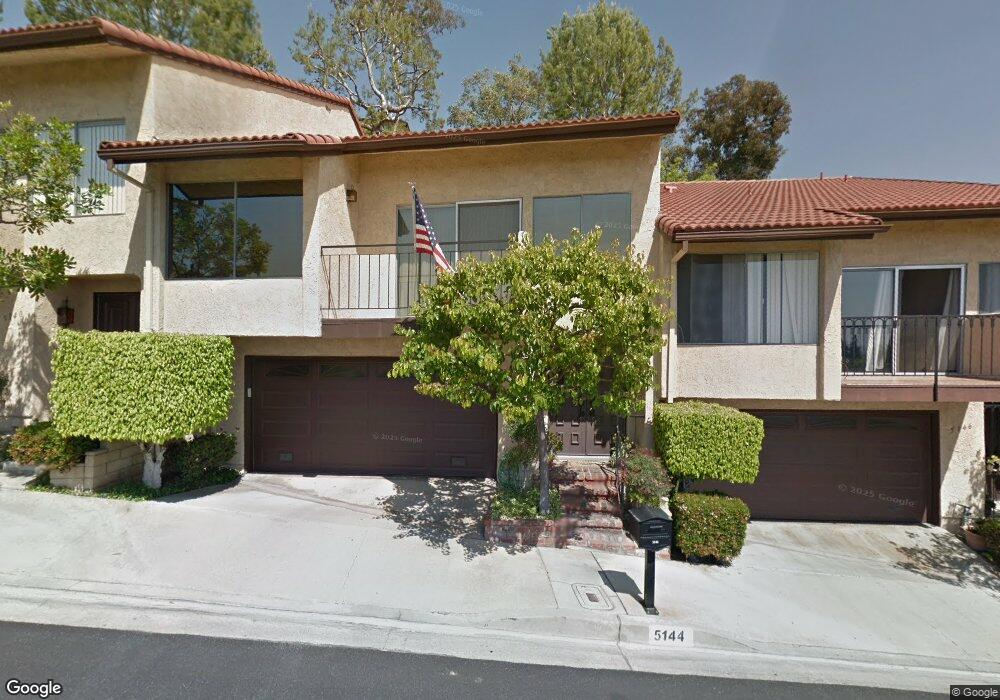
5144 Cape Tenez Dr Whittier, CA 90601
West Whittier NeighborhoodEstimated Value: $679,000 - $726,000
3
Beds
2
Baths
1,576
Sq Ft
$450/Sq Ft
Est. Value
About This Home
This home is located at 5144 Cape Tenez Dr, Whittier, CA 90601 and is currently estimated at $708,697, approximately $449 per square foot. 5144 Cape Tenez Dr is a home located in Los Angeles County with nearby schools including Longfellow Elementary School, Walter F. Dexter Middle School, and Whittier High School.
Ownership History
Date
Name
Owned For
Owner Type
Purchase Details
Closed on
Nov 16, 2018
Sold by
Motgomery John R
Bought by
Montgomery John R and The John R Montgomery Living T
Current Estimated Value
Create a Home Valuation Report for This Property
The Home Valuation Report is an in-depth analysis detailing your home's value as well as a comparison with similar homes in the area
Home Values in the Area
Average Home Value in this Area
Purchase History
| Date | Buyer | Sale Price | Title Company |
|---|---|---|---|
| Montgomery John R | -- | None Available |
Source: Public Records
Tax History Compared to Growth
Tax History
| Year | Tax Paid | Tax Assessment Tax Assessment Total Assessment is a certain percentage of the fair market value that is determined by local assessors to be the total taxable value of land and additions on the property. | Land | Improvement |
|---|---|---|---|---|
| 2025 | $3,383 | $266,987 | $90,761 | $176,226 |
| 2024 | $3,383 | $261,753 | $88,982 | $172,771 |
| 2023 | $3,337 | $256,622 | $87,238 | $169,384 |
| 2022 | $3,285 | $251,591 | $85,528 | $166,063 |
| 2021 | $3,211 | $246,658 | $83,851 | $162,807 |
| 2020 | $3,142 | $244,130 | $82,992 | $161,138 |
| 2019 | $3,111 | $239,344 | $81,365 | $157,979 |
| 2018 | $3,028 | $234,652 | $79,770 | $154,882 |
| 2016 | $2,893 | $225,542 | $76,673 | $148,869 |
| 2015 | $2,833 | $222,155 | $75,522 | $146,633 |
| 2014 | $2,797 | $217,804 | $74,043 | $143,761 |
Source: Public Records
Map
Nearby Homes
- 10605 Cordoba Ct
- 5115 Castelotte Ct
- 5307 Woodward Ln
- 5315 Bihr Ct
- 5107 Vista Verde Way
- 11511 Beverly Dr
- 11759 S Circle Dr
- 5518 Norwalk Blvd
- 11302 Maple St
- 4503 Silver Tip Dr
- 5577 Pioneer Blvd Unit 5
- 11338 Ridgegate Dr
- 5593 Pioneer Blvd Unit 18
- 4512 Workman Mill Rd Unit 128
- 10503 Los Serranos Dr
- 9943 Noyes St
- 9900 Tagus St Unit 30
- 10013 Obregon St
- 10050 Obregon St
- 11506 Sierra Sky Dr
- 5148 Cape Tenez Dr Unit 53
- 5140 Cape Tenez Dr
- 5136 Cape Tenez Dr
- 5146 Cape Tenez Dr
- 5132 Cape Tenez Dr Unit 58
- 5132 Cape Tenez Dr
- 5152 Cape Tenez Dr
- 5154 Cape Tenez Dr
- 5128 Cape Tenez Dr
- 5131 Tierra Granada Dr
- 5135 Tierra Granada Dr
- 5156 Javalambre Dr
- 5126 Cape Tenez Dr
- 5022 Tierra Antigua Dr
- 5020 Tierra Antigua Dr
- 5139 Tierra Granada Dr
- 5152 Javalambre Dr
- 5148 Javalambre Dr
- 5024 Tierra Antigua Dr
- 5144 Javalambre Dr