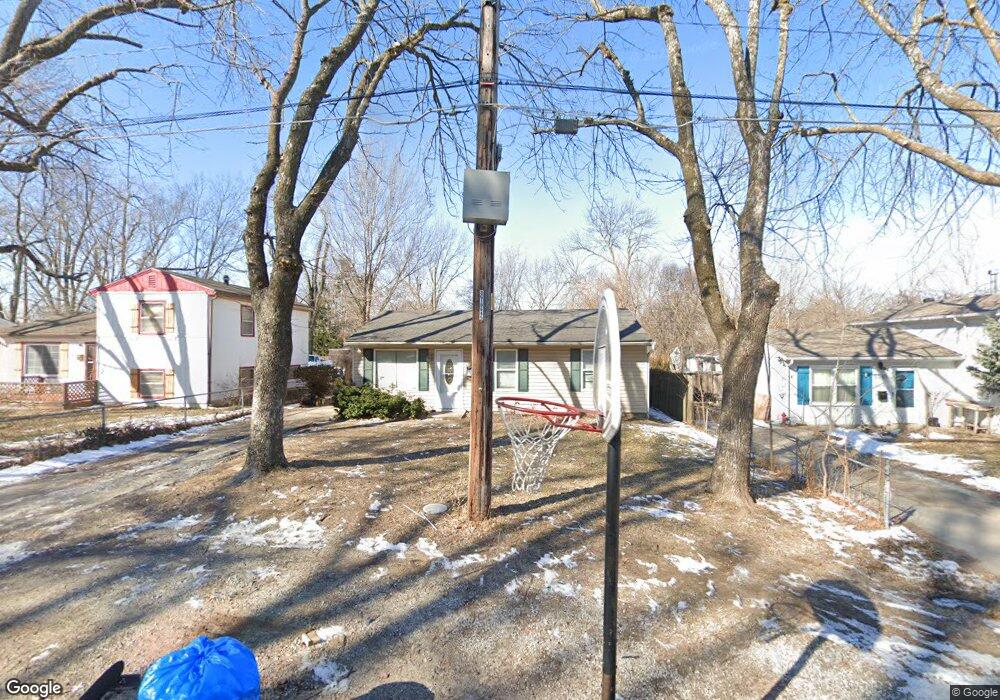
5144 Skiles Ave Kansas City, MO 64129
Eastwood Hills East NeighborhoodEstimated Value: $106,000 - $161,000
3
Beds
1
Bath
1,110
Sq Ft
$124/Sq Ft
Est. Value
About This Home
This home is located at 5144 Skiles Ave, Kansas City, MO 64129 and is currently estimated at $138,162, approximately $124 per square foot. 5144 Skiles Ave is a home located in Jackson County with nearby schools including Eastwood Hills Elementary, Raytown Middle School, and Raytown South High School.
Ownership History
Date
Name
Owned For
Owner Type
Purchase Details
Closed on
Jul 8, 2016
Sold by
Mckinnis Real Estate Llc
Bought by
Monaghan Andrew
Current Estimated Value
Home Financials for this Owner
Home Financials are based on the most recent Mortgage that was taken out on this home.
Original Mortgage
$48,750
Outstanding Balance
$38,867
Interest Rate
3.54%
Mortgage Type
New Conventional
Estimated Equity
$99,295
Purchase Details
Closed on
Feb 5, 2015
Sold by
B & R Homes Llc
Bought by
Mckinnis Real Estate Llc
Purchase Details
Closed on
May 14, 2004
Sold by
Ballard Robert L and Ballard Robert L
Bought by
B & R Homes Llc
Home Financials for this Owner
Home Financials are based on the most recent Mortgage that was taken out on this home.
Original Mortgage
$55,200
Interest Rate
5.81%
Mortgage Type
Purchase Money Mortgage
Purchase Details
Closed on
Dec 3, 2003
Sold by
Weaver Lorene
Bought by
Ballard Robert L
Create a Home Valuation Report for This Property
The Home Valuation Report is an in-depth analysis detailing your home's value as well as a comparison with similar homes in the area
Home Values in the Area
Average Home Value in this Area
Purchase History
| Date | Buyer | Sale Price | Title Company |
|---|---|---|---|
| Monaghan Andrew | -- | None Available | |
| Mckinnis Real Estate Llc | -- | None Available | |
| B & R Homes Llc | -- | All American Title Company | |
| Ballard Robert L | -- | -- |
Source: Public Records
Mortgage History
| Date | Status | Borrower | Loan Amount |
|---|---|---|---|
| Open | Monaghan Andrew | $48,750 | |
| Previous Owner | B & R Homes Llc | $55,200 |
Source: Public Records
Tax History Compared to Growth
Tax History
| Year | Tax Paid | Tax Assessment Tax Assessment Total Assessment is a certain percentage of the fair market value that is determined by local assessors to be the total taxable value of land and additions on the property. | Land | Improvement |
|---|---|---|---|---|
| 2025 | $1,479 | $11,558 | $2,360 | $9,198 |
| 2024 | $1,469 | $16,340 | $2,115 | $14,225 |
| 2023 | $1,469 | $16,340 | $1,860 | $14,480 |
| 2022 | $818 | $8,740 | $1,682 | $7,058 |
| 2021 | $818 | $8,740 | $1,682 | $7,058 |
| 2020 | $824 | $8,705 | $1,682 | $7,023 |
| 2019 | $809 | $8,705 | $1,682 | $7,023 |
| 2018 | $739 | $7,990 | $1,792 | $6,198 |
| 2017 | $739 | $7,990 | $1,792 | $6,198 |
| 2016 | $716 | $7,789 | $1,957 | $5,832 |
| 2014 | $697 | $7,562 | $1,900 | $5,662 |
Source: Public Records
Map
Nearby Homes
- 5132 Skiles Ave
- 4701 Skiles Ave
- 5002 Skiles Ave
- 4958 Marsh Ave
- 7803 E 50th Terrace
- 5117 Booth Ave
- 5140 Booth Ave
- 5119 Booth Ave
- 4949 Laramie Ln
- 7525 E 52nd St
- 7605 Sni A Bar Terrace
- 7509 E 50th St
- 5500 Wallace Ave
- 8705 E 53rd Terrace
- 4881 Wallace Ave
- 7405 E 49th St
- 7700 E 48th Terrace
- 7615 E 48th St
- 8855 E 53rd Terrace
- 5609 Oakland Ave
- 5140 Skiles Ave
- 5148 Skiles Ave
- 5202 Skiles Ave
- 5136 Skiles Ave
- 5206 Skiles Ave
- 5205 Skiles Ave
- 5207 Skiles Ave
- 5210 Skiles Ave
- 5209 Skiles Ave
- 5100 Skiles Ave
- 5100 Skiles Ave
- 5203 Skiles Ave
- 5128 Skiles Ave
- 5149 Sycamore Ave
- 5141 Sycamore Ave
- 5211 Skiles Ave
- 5203 Sycamore Ave
- 5137 Sycamore Ave
- 5133 Sycamore Ave
- 5207 Sycamore Ave